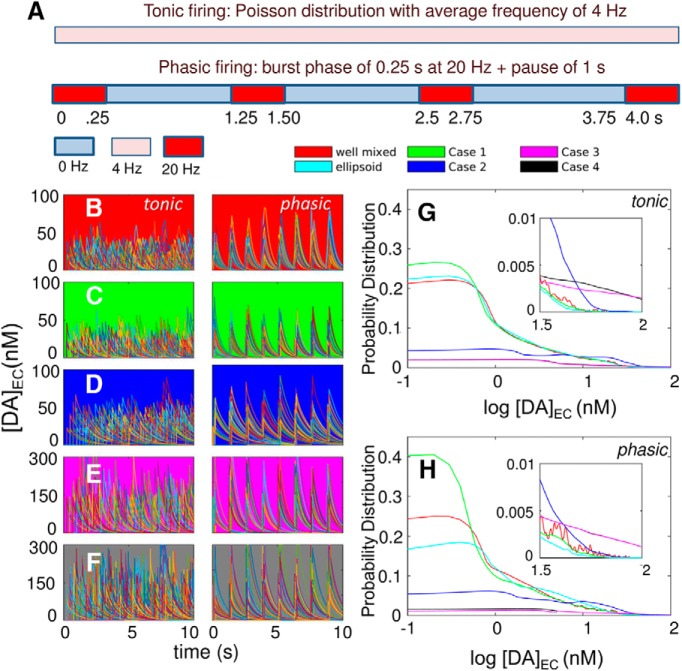
Figure 9.
Comparative analysis of global EC DA levels under different firing patterns and the effect of the complexity of cell geometry and the heterogeneity of DAT surface density. A, Schematic description of the firing patterns: tonic (upper bar) and phasic (lower bar). Each color represents a different firing frequency. Tonic firing has a constant vesicular release frequency of 4 Hz throughout the complete duration of the simulations (here shown for 4 s). Phasic firing has burst periods of 0.25 s with a firing frequency of 20 Hz separated by pauses of 1 s. B–F, Time evolution of [DA]EC for five models: well-mixed (background colored red); MCell with uniform distribution of DATs (background in green); MCell with nonuniform distributions of DATs (cases 2–4 in Fig. 2; background in blue, magenta, and gray, respectively), presented for tonic (left) and phasic (right) firing patterns. Each panel displays the results from 140 individual trajectories from independent runs. G,H, Probability distributions of log [DA]EC level observed in different runs, shown for tonic (G) and phasic (H) firing patterns. The respective insets show the behavior in the range log[DAEC/nM] > 1.5. Results for ellipsoid geometry are presented in cyan. The principal semi-axis lengths of the ellipsoid are 8.73, 1.44, and 4.36 μm, which yield the same surface area and volume with the realistic geometry.

