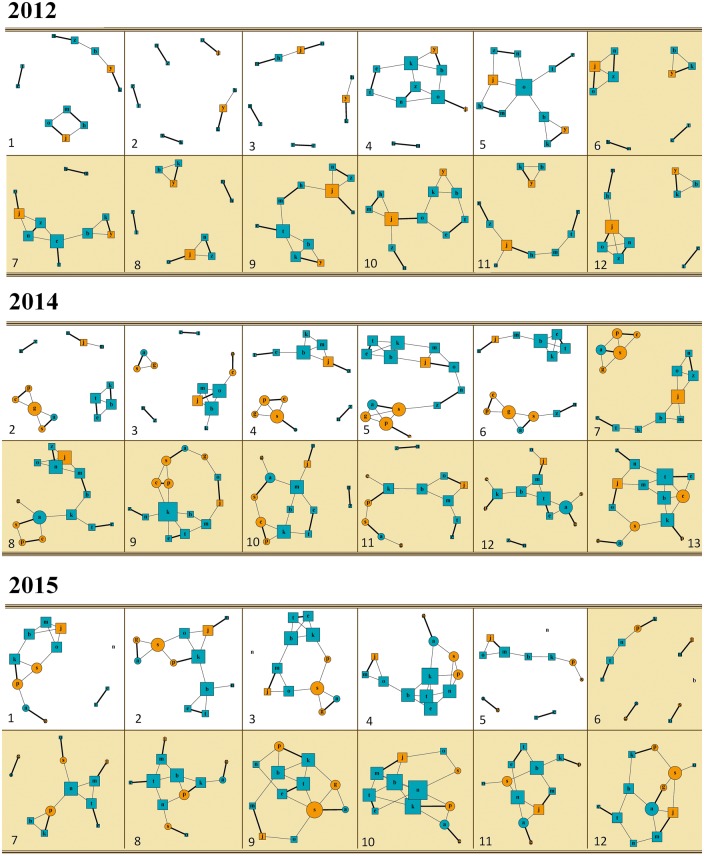
Figure 2.
Temporal modifications of the social networks of social pairs and extra-pair affiliations, computed per week between January and the end of April, in 2012, 2014, and 2015. The thicker lines represent the social pairs, and the thinner the extra-pair affiliations. Females are represented in orange and males in blue. Squares represent original group members, and circles newly added members (i.e., present in the group in 2014 and 2015). The size of the nodes (i.e., individuals) is proportional to the degree of the individual in the network (i.e., total number of social partners an individual is connected to). Finally, networks with colored background occur during the breeding season (i.e., March to the end of April). Note that to homogenize the visualization, the first network in 2014 is not reported here, as 13 networks were used in 2014 instead of 12 in 2012 and 2015.

