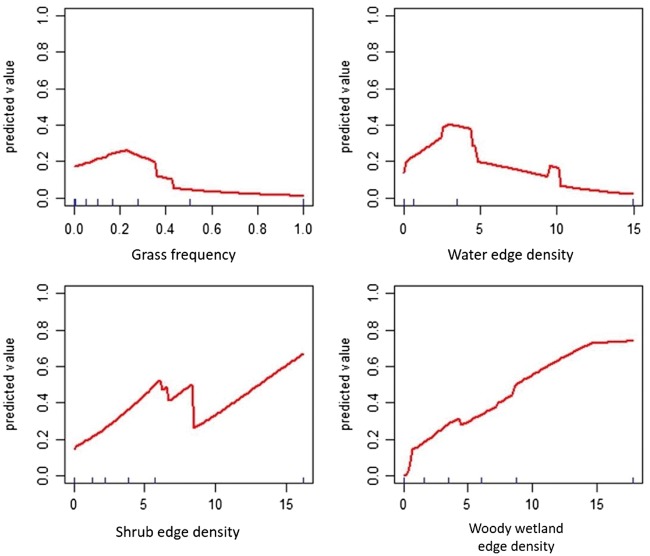
Figure 2.
Response curves of predicted occurrence likelihood of grassland frequency, water edge density, shrub edge density, and woody wetland edge density in the Maxent model for the habitat suitability of American beaver. Each curve represents how the predicted likelihood of habitat suitability changes with increased value of a landscape variables while the other landscape variables are held at averages.

