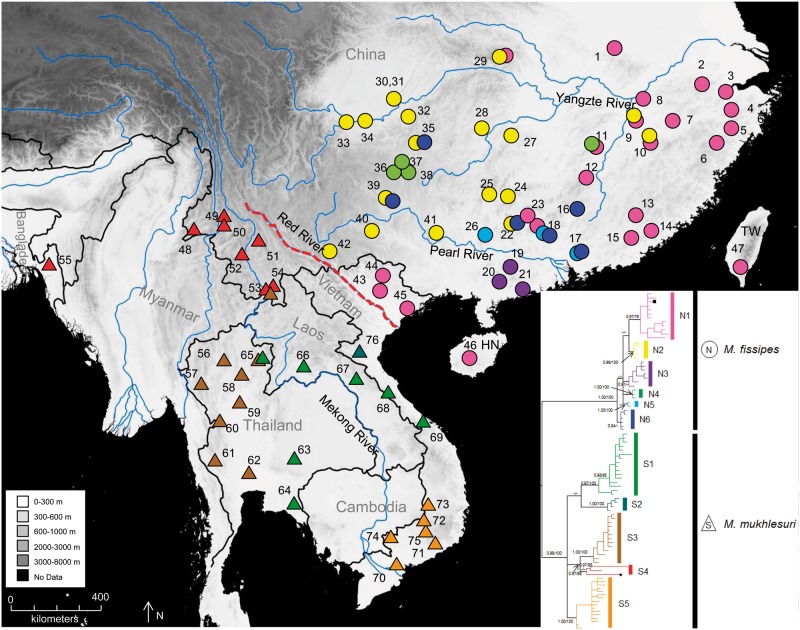
Figure 1.
Geographic distribution of samples of the M. fissipes complex. Localities are detailed in Supplementary Table S1 (supporting information). Colored triangles and circles correspond to the major matrilines in Figure 2. Dotted line denotes the Red River. Inset shows a simplified genealogy with major matrilines corresponding to Figure 2. The abbreviations HN and TW refer to Hainan and Taiwan, China, respectively.

