Figure 3.

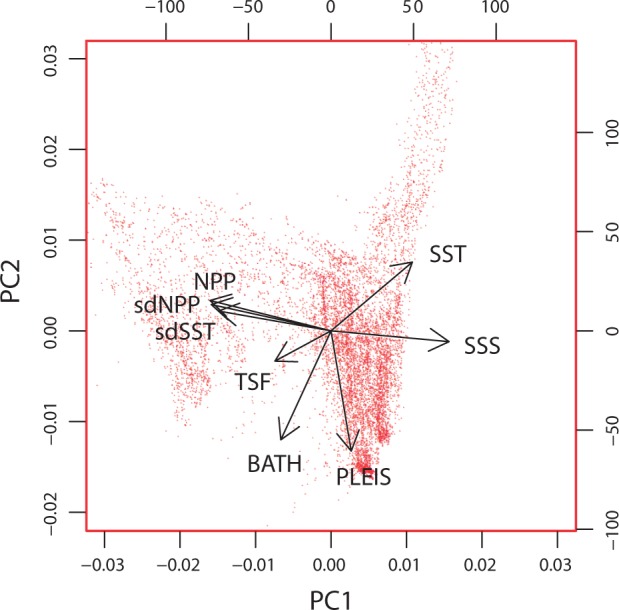
Biplot indicating PCA-based loadings of European seascape variables. PCA results showing environmental variables (vectors) plotted onto PC1 and PC2 from 10,000 randomly selected points in the seascape.

Biplot indicating PCA-based loadings of European seascape variables. PCA results showing environmental variables (vectors) plotted onto PC1 and PC2 from 10,000 randomly selected points in the seascape.