. 2018 Feb 5;9:19–25. doi: 10.2147/OAJSM.S155526
© 2018 Knechtle and Nikolaidis. This work is published and licensed by Dove Medical Press Limited
The full terms of this license are available at https://www.dovepress.com/terms.php and incorporate the Creative Commons Attribution – Non Commercial (unported, v3.0) License (http://creativecommons.org/licenses/by-nc/3.0/). By accessing the work you hereby accept the Terms. Non-commercial uses of the work are permitted without any further permission from Dove Medical Press Limited, provided the work is properly attributed.
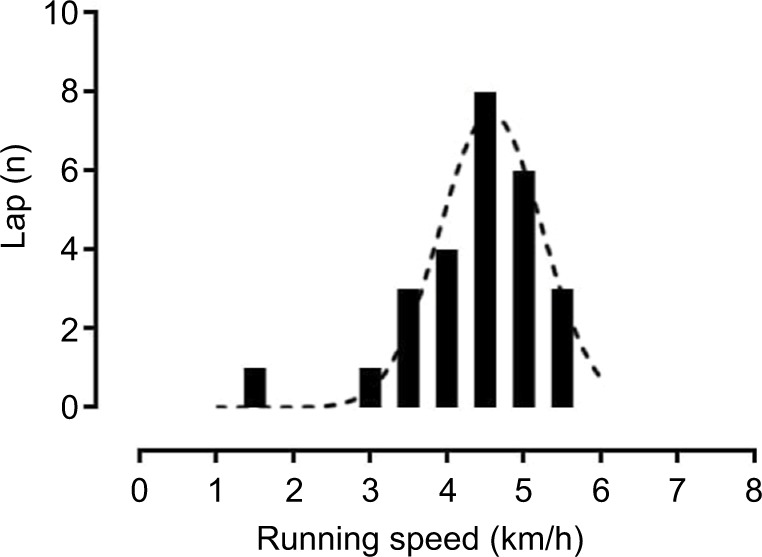
Figure 4.

Distribution of lap speed.
Note: Normal distribution is represented by dashed line.
