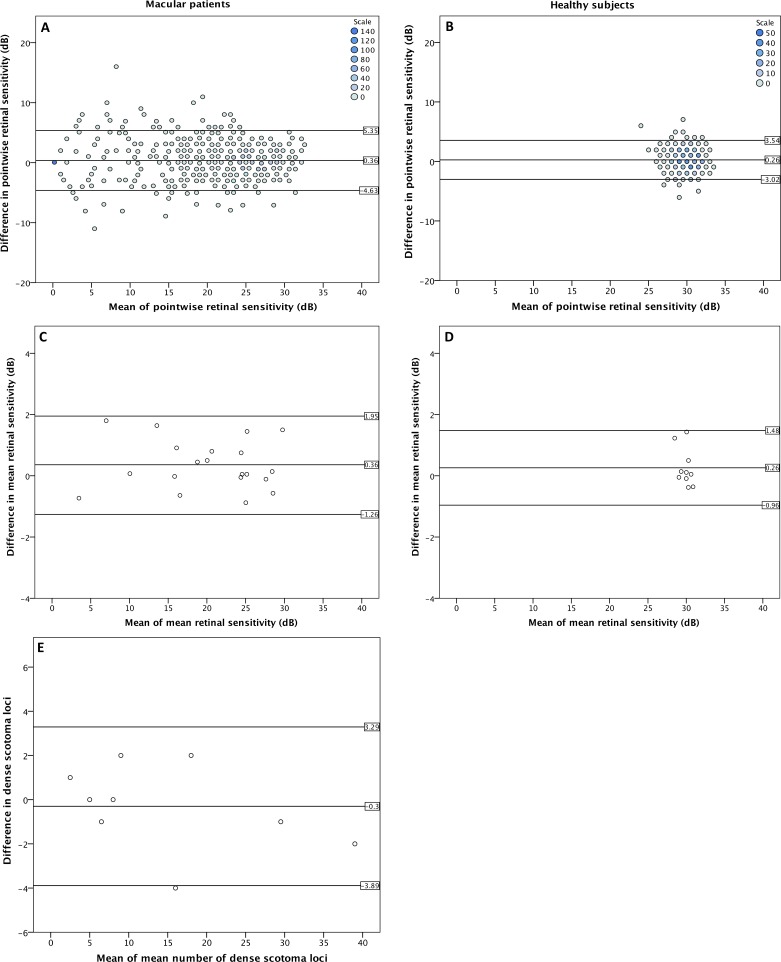
Figure 3.
Bland-Altman plots; (A, B) Binned Bland-Altman plots for pointwise retinal sensitivity (presenting all data points of the measurements) for macula patients and healthy subjects, respectively. (C, D) Bland-Altman plots for mean retinal sensitivity (presenting the average of all data points of the measurements) for macula patients and healthy subjects, respectively. (E) Bland-Altman plots for deep scotoma size for 10 macula patients (at least one test location with a retinal sensitivity of 0 dB). Horizontal lines and numbers indicate 95% upper limit, the mean, and the 95% lower limit of the difference.

