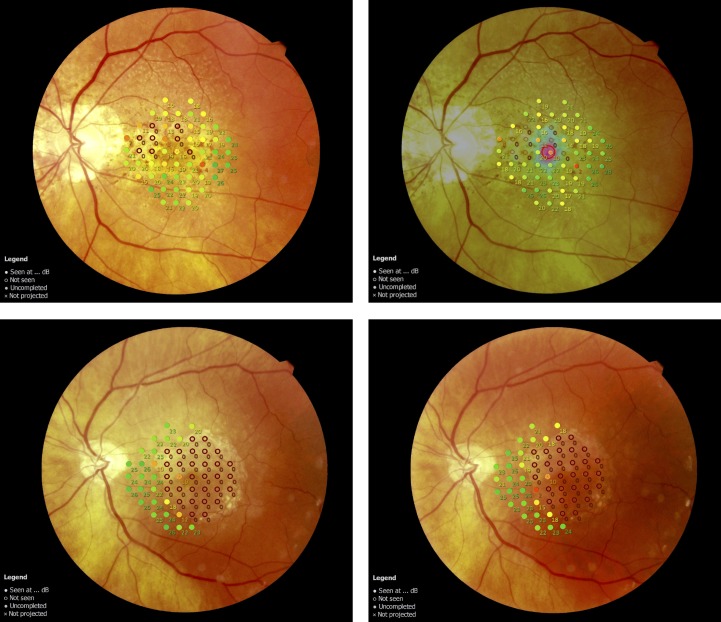
Figure 4.
Microperimetry finding of two patients with geographic atrophy. Findings from test 2 are presented on the left side, those from test 3 on the right. First patient (top row) presented a small area of geographic atrophy, with perfect agreement between test 2 and test 3. A larger area of geographic atrophy was found in the second patient (bottom row). Correspondence of deep scotoma size differed in one test location in this patient.

