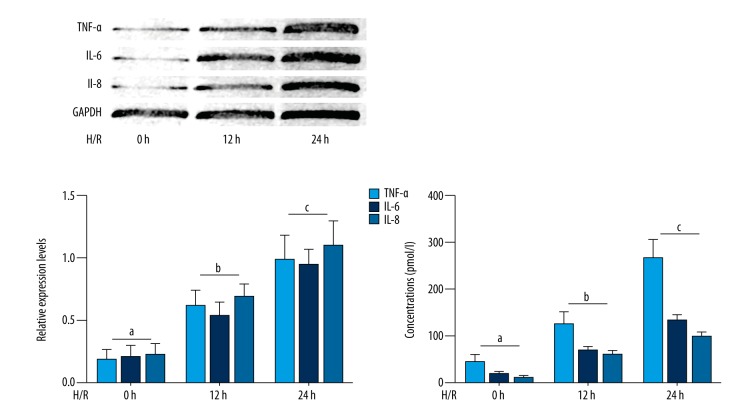
Figure 1.
Cultured human aortic endothelial cells (HAECs) exposed to hypoxia-reoxygenation and time-dependent inflammatory cytokine expression The upper part of left panel shows the immunoblots of tumor necrosis factor (TNF)-α, interleukin (IL)-6 and IL-8 in cultured HAECs exposed to hypoxia-reoxygenation for 0, 12, and 24 hours. Columns on the lower part of left panel indicate the relative expression levels (normalized to GAPDH) of TNF-α (light blue columns), IL-6 (deep blue columns) and IL-8 (blue columns) in cultured HAECs exposed to hypoxia-reoxygenation for 0, 12 and 24 hours respectively. Columns on the right of this figure indicate the detected concentrations of TNF-α (light blue columns), IL-6 (deep blue columns) and IL-8 (blue columns) in culture medium supernatant of cultured HAECs exposed to hypoxia-reoxygenation for 0, 12 and 24 hours respectively. Differences are significant (p<0.05) between a. and b.; and were significant (p<0.05) between b. and c.

