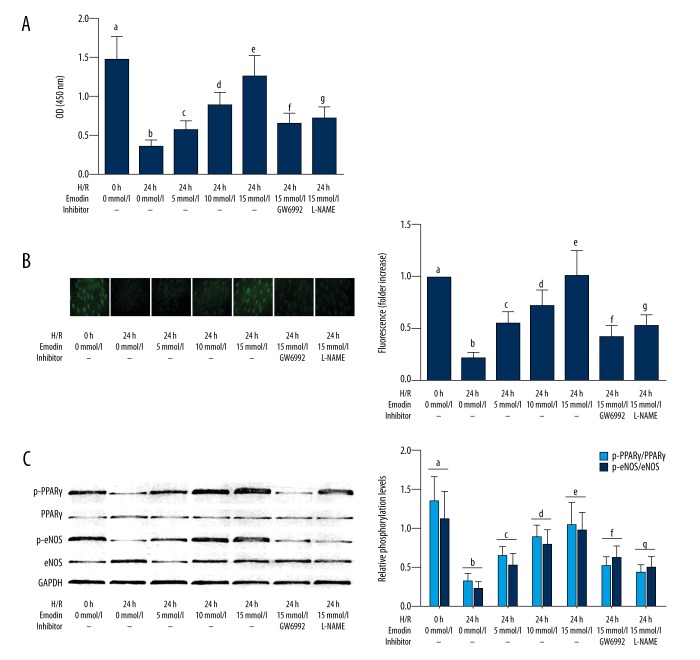
Figure 4.
Cultured human aortic endothelial cells (HAECs) exposed to hypoxia-reoxygenation, expression of inflammatory cytokines, and treatment with emodin and inhibitors of peroxisome proliferator-activated receptor-γ (PPAR-γ) and endothelial nitric oxide synthase (eNOS). (A) Columns show the detected O.D. at 450nm indicating peroxisome proliferator-activated receptor-γ (PPAR-γ) activities in cultured human aortic endothelial cells (HAECs) exposed to hypoxia-reoxygenation co-treated with emodin and inhibitors of PPARγ/endothelial nitric oxide synthase (eNOS), respectively. (B) The left part of this panel demonstrates the captured fluorescent images of diaminofluorescein-FM diacetate (DAF-FM DA) fluorescence staining of HAECs. Columns on the right part of this panel indicated the fluorescent intensities of DAG-FM DA stain of HAECS exposed to hypoxia-reoxygenation co-treated with emodin and inhibitors of PPARγ/eNOS, respectively. (C) The immunoblots of p-PPAR, PPAR, p-eNOS, eNOS and GAPDH are demonstrated on the right part of this panel. Columns on the right part indicate the relative phosphorylation levels of PPAR-γ (light blue columns) and eNOS (deep blue columns) in HAECS exposed to hypoxia-reoxygenation co-treated with emodin and inhibitors of PPARγ/eNOS, respectively. Differences were significant (p<0.05) between a. and b. Differences were significant (p<0.05) between b. and c. Differences were significant (p<0.05) between d. and c. Differences were significant (p<0.05) between e. and d. Differences were significant (p<0.05) between f. and e. Differences were significant (p<0.05) between g. and e.

