. 2018 Mar;113(3):153–160. doi: 10.1590/0074-02760170267

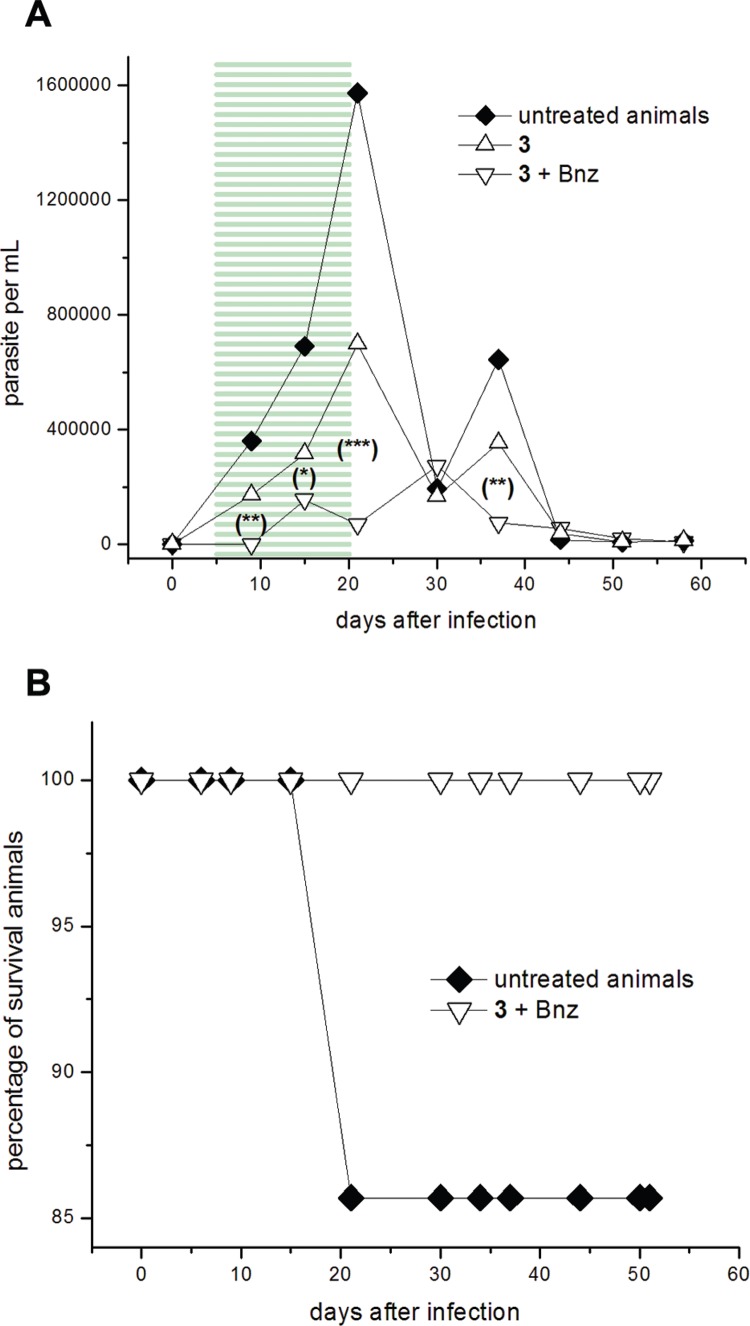
Fig. 6. in vivo proof of concept. Course of infection of BALB/c male mice inoculated (i.p.) with 5 × 10³-1 × 10⁴ blood trypomastigotes of Trypanosoma cruzi clone CL Brener and orally treated for 15 consecutive days from 6 to 20 dpi. Experimental groups: 192.0 μmol (50 mg)/kg b.w./day of furan 3 (Δ) (from reference Aguilera et al. 2016), or 192.0 μmol (50 mg)/kg b.w./day of the furan 3 plus 38.5 μmol (10 mg)/kg b.w./day of Bnz (◇) and control group (infected and non-treated) (♦) (n = 7/group). (A) Parasitaemia curve. Highlighted regions (≡) correspond to the period of treatment. Statistical significant differences in relation to the control group, evaluated by the Student's t-test: (***) p < 0.03, (**) p < 0.05, (*) p < 0.06). (B) Survival curve.

Fig. 6

HHS Vulnerability Disclosure