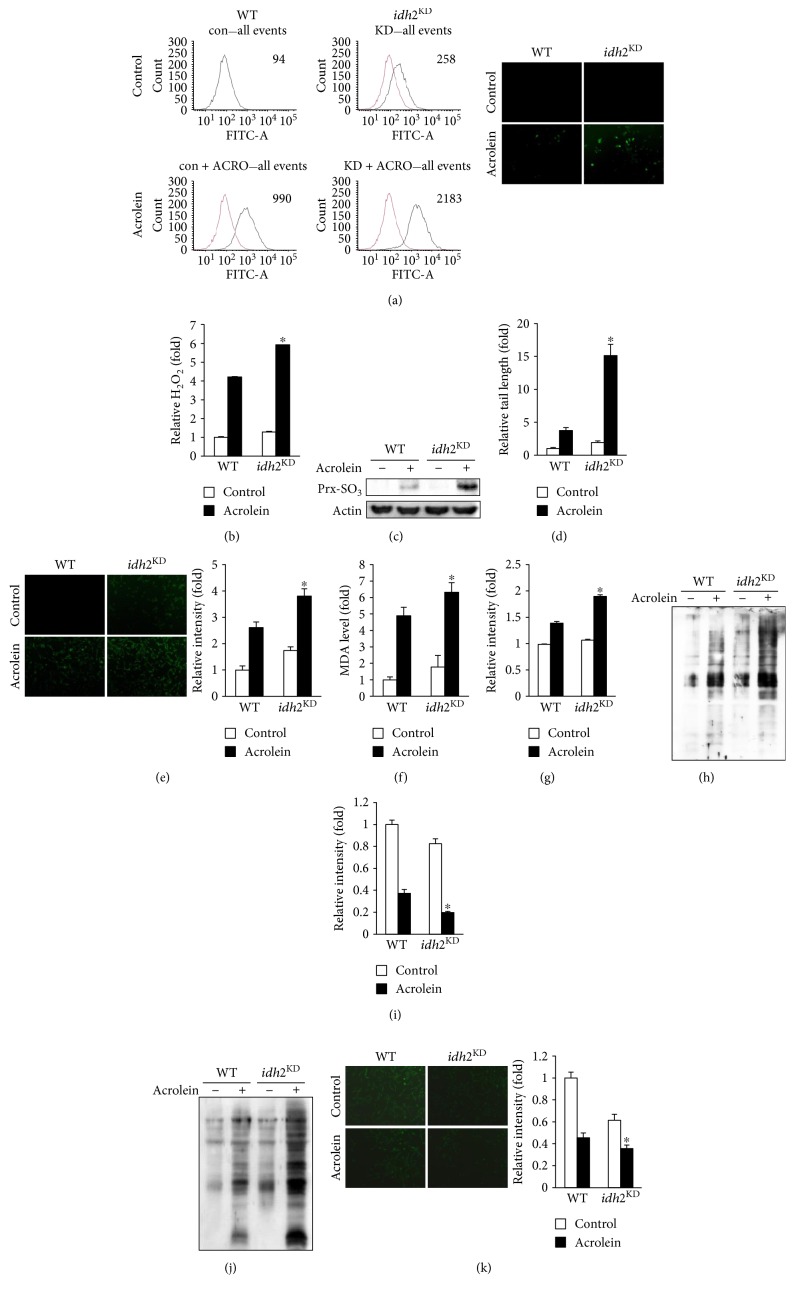
Figure 2.
Effect of idh2 knockdown on cellular redox status and oxidative damage in LLC cells exposed to acrolein. (a) LLC cells were stained with DCFH-DA for 30 min and DCF fluorescence was measured by flow cytometry and fluorescence microscopy. (b) Hydrogen peroxide production in LLC cells was measured by xylenol orange. (c) Immunoblot analysis of Prx-SO3 levels in LLC cell lysates. (d) Comet assay analysis of LLC cells and the tail/core width ratio obtained from captured images. (e) The levels of 8-OH-dG were measured by fluorescence microscopy. The average fluorescence intensity was calculated as previously described [44]. (f) The level of MDA accumulated in LLC cell extracts was determined using TBARS assay. (g) Cellular lipid peroxidation was measured with DPPP. The average fluorescence intensity was calculated as previously described [44]. (h) The level of oxidized protein adducts in the lung tissue extracts was measured with an anti-DNP antibody. (i) Fluorescence images of CMFDA-loaded cells were obtained under a microscope to evaluate cellular GSH levels. The average fluorescence intensity was calculated as previously described [44]. (j) The level of glutathionylated protein adducts in the lung tissue extracts was measured with an anti-GSH antibody. (k) Cellular NADPH level was determined by immunofluorescence using an anti-NADPH antibody. The average fluorescence intensity was calculated as previously described [44]. In (b), (d–g), (i), and (k), data are presented as the mean ± SD of four independent experiments. ∗p < 0.05 versus WT cells exposed to acrolein.

