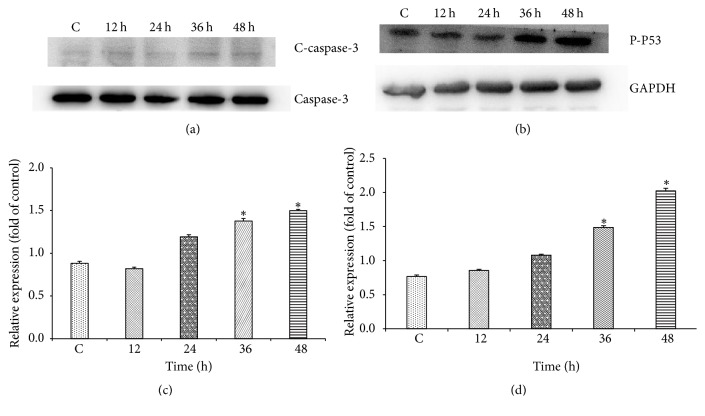
Figure 3.
The cells were exposed to the 200 μMZOL and at 12 h, 24 h, 36 h, and 48 h of exposure, the cell fractions were prepared and analyzed by 15% SDS-PAGE followed by Western blotting. (a and c) The level of c-caspase-3 in CT26 cells after being exposed to ZOL. (b and d) The level of p-p53 in CT26 cells after being exposed to ZOL. The data shown in C and D are the mean ± SD of the results of three independent experiments, respectively (∗p < 0.05 represents significant differences between the experimental and untreated control values).

