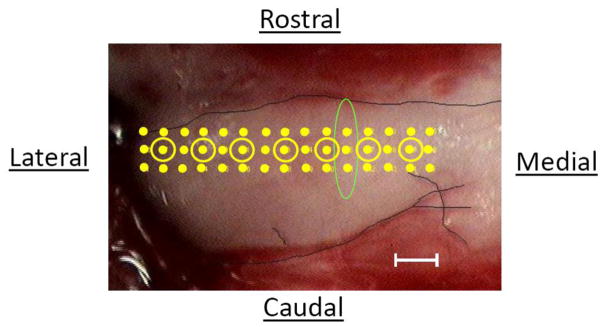
Fig. 1.
Image of the left DCN of one of the animals in the control group, viewed from a dorsal perspective, showing the locations of the different recording sites used to map spontaneous activity. Points are spaced 100 μm apart both horizontally and vertically. Locations at which recordings of spontaneous activity were preceded by recordings of frequency tuning are shown by points surrounded by circles. The outline of the DCN is demarcated by the dark line. The oval highlights 3 points that were averaged to contribute to the point in Fig. 3A for the mean activity at 1.2 mm. Scale bar = 200 μm.

