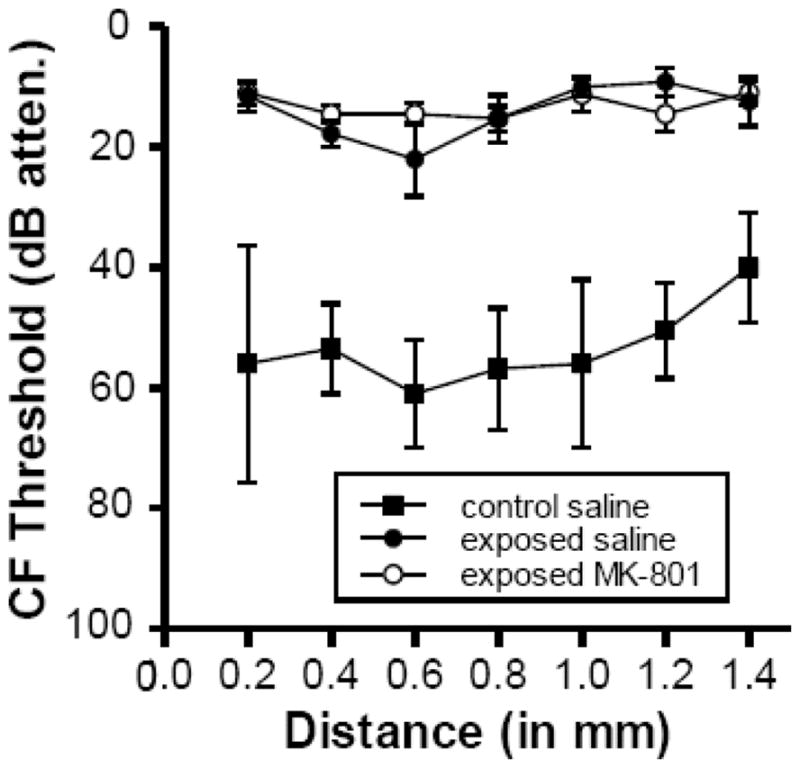
Fig. 2.

Comparison of neural response thresholds in control and the two groups of tone-exposed animals (MK-801-treated and saline-treated). Each point represents the mean CF threshold + SEM for all tuning curves that were recorded in a bin whose center is indicated on the abscissa. Tuning curve sample sizes ranged from 3–5 for control saline-treated animals (except for locus 0.55, which was based on a sample of 2 tuning curves), 5–8 for exposed saline treated (except for locus 1.4, which was based on a single tuning curve), and 7–12 for exposed MK-801 treated animals (except for loci 0.85 and 1.05, which were based on 4 and 3 tuning curves, respectively). Distance is relative to the lateral edge of the DCN. CF is defined as the frequency at which the response occurred at the lowest intensity.
