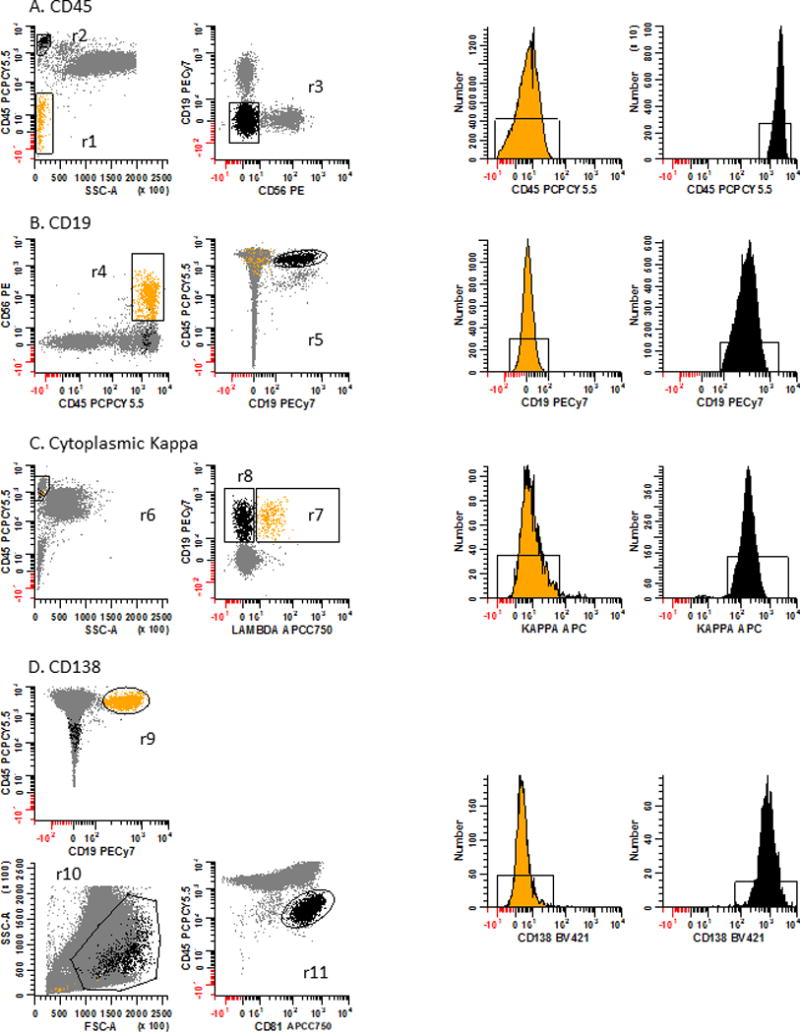
Figure 1. Signal-to-noise ratio performance assessment strategy for mAbs.

The strategy to assess the performance of each mAb in the PCD panel relies on defining a negatively and positively staining population for each mAb. These populations are defined in Table 3. Next, the median fluorescence intensity (MFI) is determined for each population and the signal-to-noise ratio calculated by dividing the positive population’s MFI by the negative population’s MFI. To qualify as an acceptable mAb, the calculated signal-to-noise value should be greater than the recommend value in Table 4. Panel 1A: For CD45, erythroid precursors are used as the negative population defined as SSClo/CD45− events (r1: yellow dots and corresponding histogram) and T cells as the positive population defined as CD45br/SSClo (r2) and CD19−/CD56− events (r3: black dots and corresponding histogram). Panel 1B: For CD19, NK cells are used as the negative population defined as CD45br/CD56+ events (r4: yellow dots and corresponding histogram) and B cells as the positive population defined as CD19+/CD45br events (r5: black dots and corresponding histogram). Panel 1C: For cKappa light chain, cLambda light chain+ B cells are used as the negative population defined as CD45br/SSC-Alo (r6) and CD19+/cLambda light chain+ events (r7: yellow dots and corresponding histogram) and cLambda light chain− cells as the positive population defined as CD45br/SSC-Alo (r6) and CD19+/cLambda light chain− events (r8: black dots and corresponding histogram). Panel 1D: For CD138 a procedural control for immunophenotyping, CD-Chex CD103™ Plus cells which contains a CD138 positive population are spiked into a bone marrow sample. B cells are used as the negative population defined as CD45br/CD19+ events (r9: yellow dots and corresponding histogram) and spiked control cells as the positive population defined by FSC-A and SSC-A (r10) and as CD45dim/CD81+ events (r11: black dots and corresponding histogram). Note these data are all gated on R1 & R2 & R3, ‘Total Leukocytes’ as defined in Fig. 2. In data not shown, for the CD19 negative and positive populations, and CD138 negative population a FSC-A vs SSC-A plot was used to define lymphocytes.
