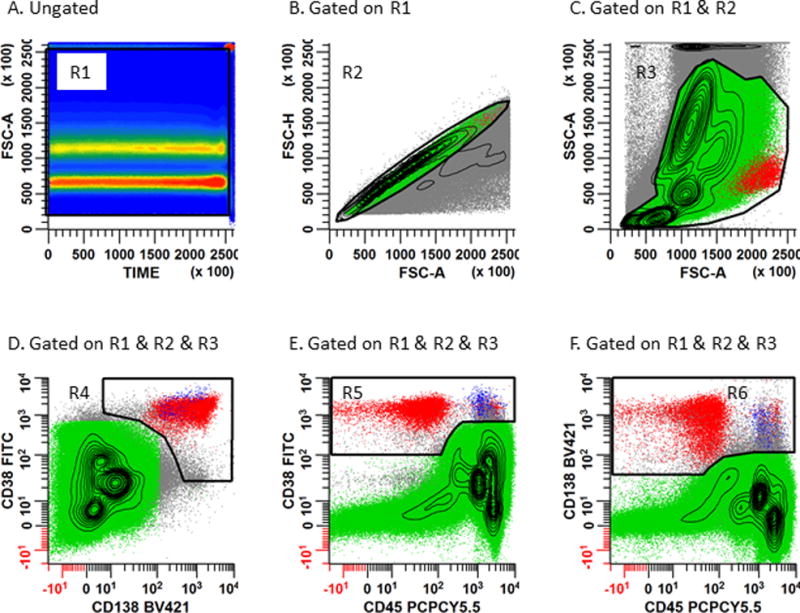
Figure 2. Gating strategy used for the identification of normal and abnormal plasma cells.

Panel 2A: A rectangular region (R1) is placed on the bivariate plot of Time vs. SSC-A to circumscribe all events collected in continuity. This dot plot can be used to assess the chronologic heterogeneity of the acquisition by eliminating any invalid events such as air bubbles which occur during the run. Panel 2B: Serial gating is performed by applying the region R1 to a bivariate plot of FSC-A vs. FSC-H. A rhomboid region (R2) is then created to include the singlet cell population. Caution should be exercised not to exclude hyperdiploid or tetraploid plasma cells which may exhibit aberrantly high light scatter characteristics. Panel 2C: Gate a bivariate plot of FSC-A vs. SSC-A on (R1 and R2). An irregular region (R3) is created to circumscribe the cell population of interest and exclude aggregated events, debris, and dead and apoptotic events. Create 3 separate bivariate plots (Panel 2D: CD138 vs. CD38), (Panel 2E: CD45 vs. CD38), and (Panel 2F: CD45 vs. CD138). Gate each of these bivariate plots on ‘Total Leukocytes’ (R1 & R2 & R3). An irregular region (R4) is drawn on Panel 2D circumscribing the CD138+/CD38+ events; another irregular region (R5) is drawn on Panel 2E circumscribing the CD45+/-/CD38+ events; a third irregular region (R6) is drawn on Panel 2F circumscribing the CD45+/-/CD138+ events. CD45 is helpful for defining PCs and identifying any CD38− or CD138− PC populations. The Boolean gate (R1 & R2 & R3 & R4 & R5 & R6) defines both normal (blue) and abnormal (red) PCs for subsequent immunophenotyping.
