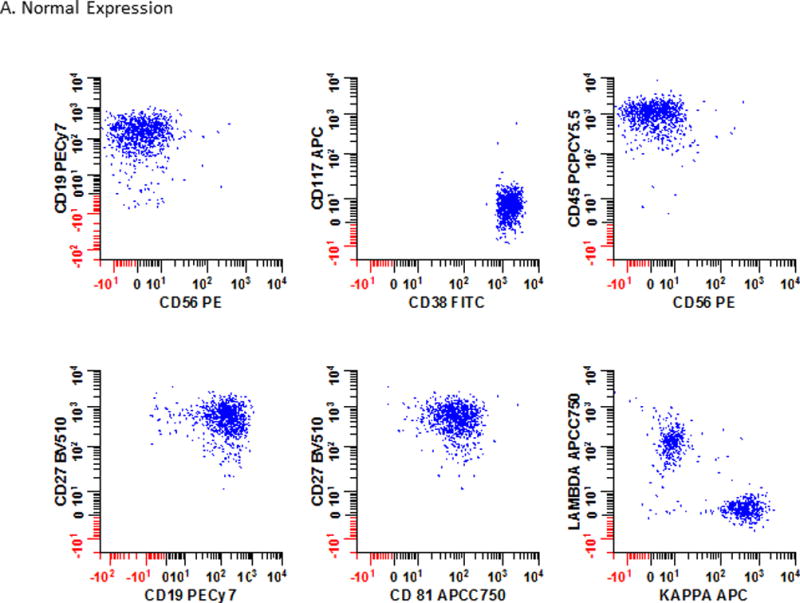
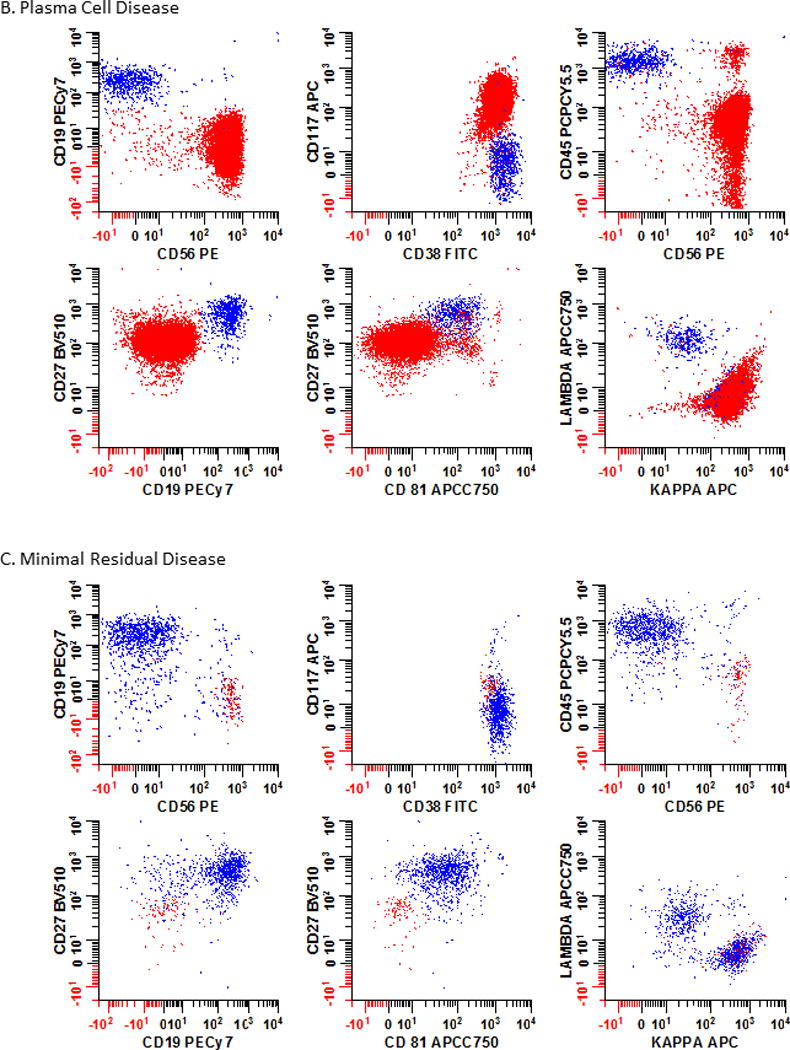
Figure 3. Immunophenotypic profiles of normal and abnormal PCs.


The immunophenotypic profiles of bone marrow from a patient (Panel 3A) with no obvious hematological disease at testing; (Panel 3B) a patient with PCD; and (Panel 3C) a patient with multiple myeloma MRD are shown. As PCD is a heterogeneous disease, no single marker can be reliably used to identify all abnormal cell populations. Instead the interpretation is based on all the markers included in the analysis. In this example, 6 different bivariate plots that were each separately gated on plasma cells using the strategy defined in Fig. 2 are shown. Blue: normal plasma cells; Red: neoplastic plasma cells.
