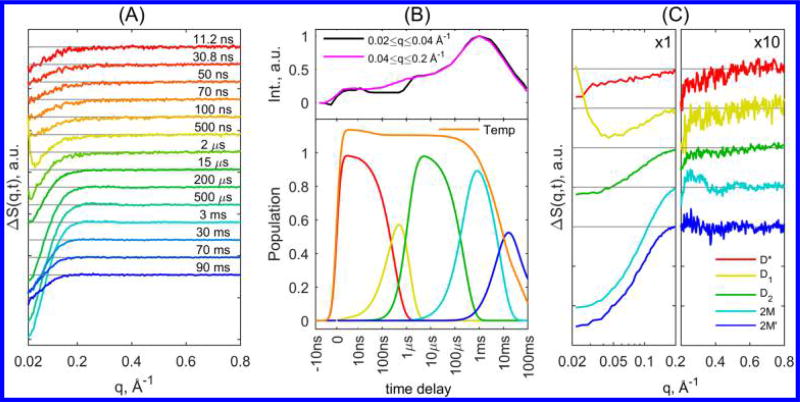
Figure 2.
(A) Characteristic TRXSS difference curves at various time delays after T-jump, presented as time series. (B) (Top) Normalized integrated signal in the region of q < 0.04 Å−1 (magenta) and 0.04 Å−1 < q < 0.2 Å−1 (black). (Bottom) Population dynamics derived from kinetic analysis for associated species along with the scaled temperature derived from fitting of pure buffer TRXSS signal to the protein TRXSS signal. (C) Species-associated TRXSS difference patterns from kinetic analysis; the signal at q > 0.2 Å−1 is multiplied by a factor of 10 to magnify the observed WAXS features. The legend is shared for both B and C panels.

