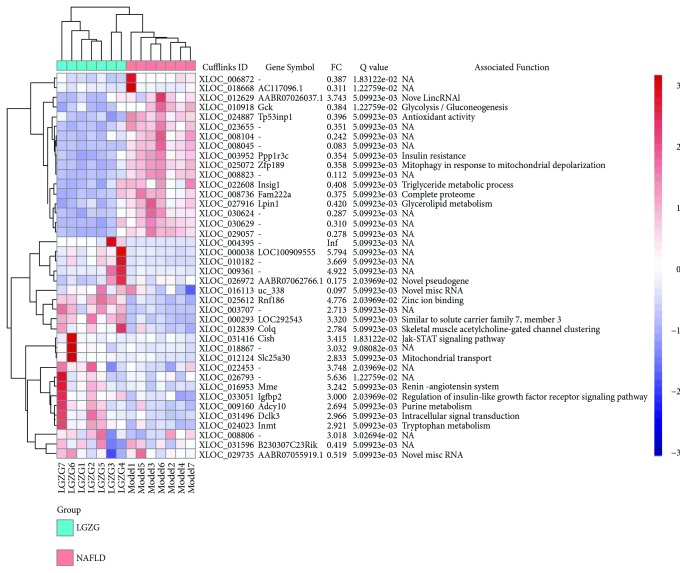
Figure 5.
Differential expression of top 40 LGZG-regulated genes. The samples of the NAFLD model group formed a clade and were separated from the samples of the LGZG-treated NAFLD groups. The color scale shown at the top right illustrates the relative expression level of the genes across all samples. FC, fold change between LGZG-treated NAFLD and NAFLD model groups.

