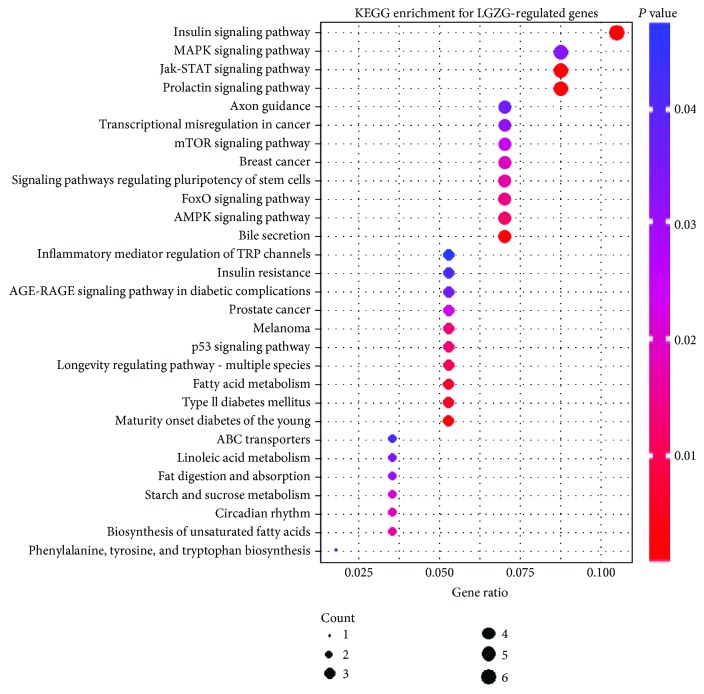
Figure 6.
Scatter plot of the enriched KEGG pathways for LGZG-regulated genes. The x-axis represents the ratio of LGZG-regulated gene numbers annotated in this KEGG pathway to all gene numbers annotated in this KEGG pathway. The y-axis is enriched KEGG pathways. P value was calculated from hypergeometric test. A smaller P value indicates higher significance (P < 0.05).

