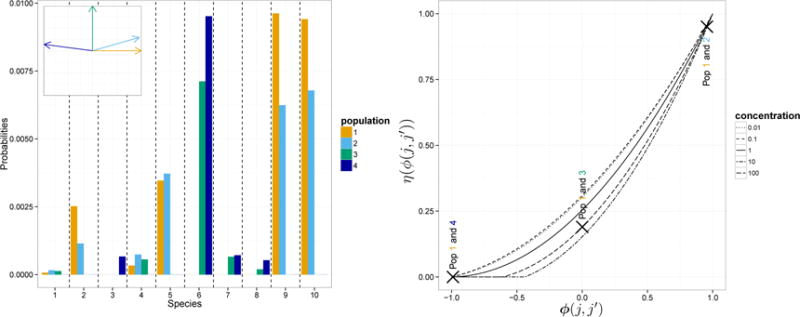
Figure 1.
(Left) Realization of 4 microbial distributions from our dependent Dirichlet processes. We illustrate 10 representative OTUs and set α = 100. The miniature figure at the top-left corner shows the relative positions of the four biological sample vectors Yj. The OTUs are those associated to the 10 largest σ’s. As suggested by this panel, the larger the angle between two Yj’s, the more the corresponding random distributions tend to concentrate on distinct sets. (Right) Correlation of two random probability measures when the cosine ϕ(j, j′) between Yj and varies from −1 to 1. We consider five different values of the concentration parameter α. In the right panel we also mark with crosses the correlations between Pj(A) and (A) for pairs of biological samples j, j′ considered in the left panel.

