Figure 2.
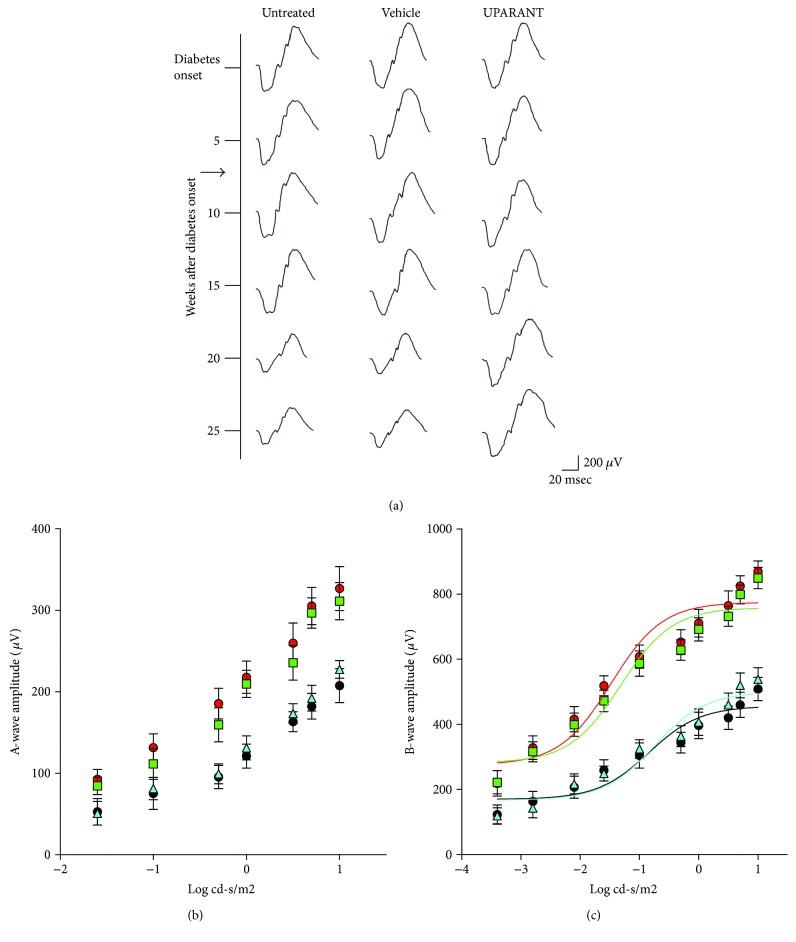
Effects of UPARANT on ERG responses. (a) Schematic representation of longitudinal ERG monitoring at different times after diabetes onset (corresponding to 20 weeks of age). The arrow indicates the beginning of the treatment (7 mg/kg UPARANT or vehicle, given subcutaneously 3 times a week for 19 weeks). The treatment was initiated at 7 weeks after diabetes onset. (b, c) Scotopic a-wave (b) and b-wave (c) amplitudes plotted as a function of increasing light intensity in control SD rats (red circles and red line) and in SDT rats, untreated (black circles and black line), vehicle-treated (light blue triangles and light blue line), or treated with subcutaneous UPARANT (green squares and green line). In respect to SD rats, both a-wave and b-wave amplitude was reduced in SDT rats, untreated or vehicle-treated. In UPARANT-treated rats, the amplitudes of the a- and b-waves did not significantly differ from those measured in SD rats (two-way ANOVA followed by Bonferroni's multiple comparison posttest). Each point represents the mean ± SEM of data from 8 (untreated and vehicle-treated SDT) or 9 (SD controls and UPARANT-treated SDT) rats.

