Figure 5.
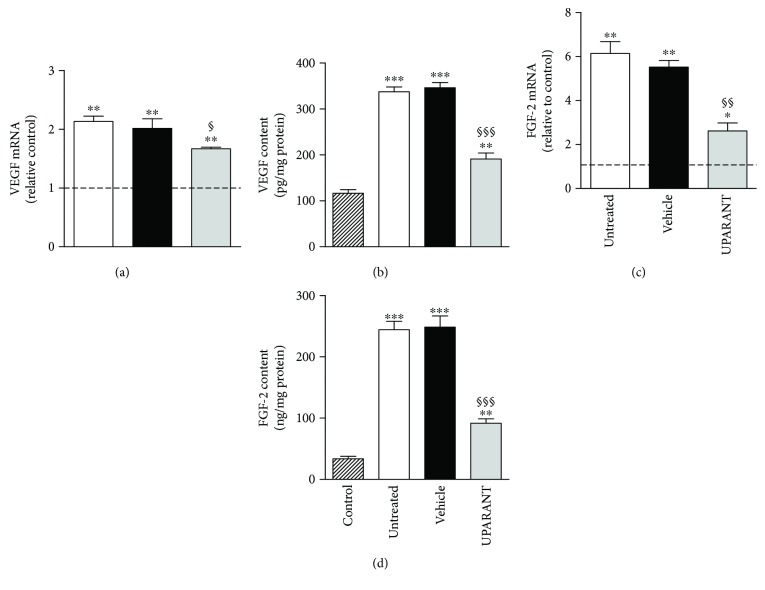
Effects of UPARANT on VEGF and FGF-2. (a, c) Transcript levels of VEGF (a) and FGF-2 (c) were evaluated by qPCR. Data were analyzed by the formula 2−∆∆CT using Rpl13a and Hprt as internal standards. (b, d) Protein levels of VEGF (b) and FGF-2 (d) were evaluated by ELISA. In untreated or vehicle-treated SDT rats, levels of VEGF and FGF-2 were increased with respect to SD rats, while UPARANT treatment reduced this increase. ∗P < 0.05, ∗∗P < 0.01, and ∗∗∗P < 0.001 versus control; §P < 0.05, §§P < 0.01, and §§§P < 0.001 versus vehicle (one-way ANOVA followed by Newman–Keuls' multiple comparison posttest; power values: 0.98 (a) and 0.99 (b–d)). Each column represents the mean ± SEM of data from 3 independent samples, each containing 1 retina.

