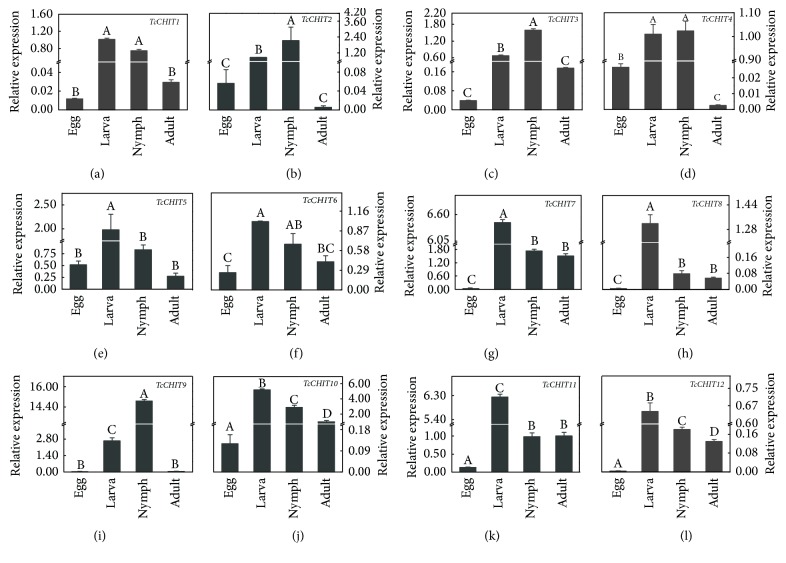
Figure 3.
RT-qPCR evaluation of the developmentally specific expression patterns of the 12 CHIT genes in T. cinnabarinus. The following life stages were analyzed: egg, larvae, nymph, and adult. Error bars represent the standard error of the calculated mean based on three biological replicates. Different letters on the error bars indicate significant difference according to Duncan's multiple tests (alpha = 0.05), that is, no statistical difference between “A” and “A”; significant difference among “A,” “B,” “C,” and “D.” RPS18 was used as the reference gene. (a) to (l) were TcCHIT1~12, respectively.

