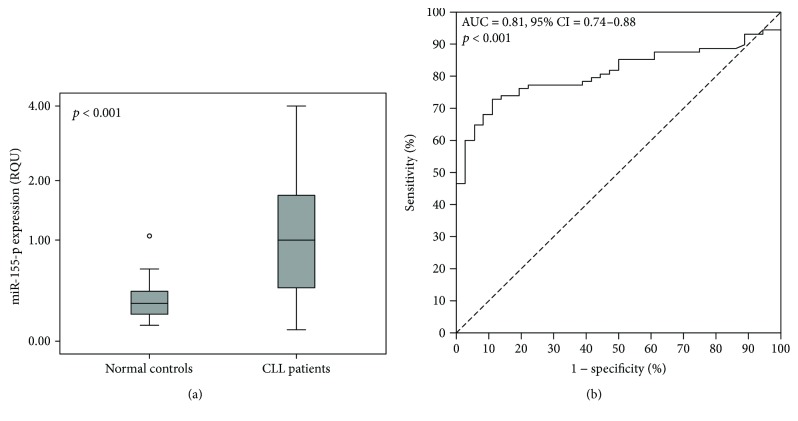
Figure 1.
Significant differences are observed in miR-155-5p expression between CLL patients and nonleukemic individuals, thus allowing the discrimination of CLL patients from normal population. (a) Boxplots show the miR-155-5p expression levels in nonleukemic population and CLL patients. The line bars indicate the median value (50th percentile) for each patient cohort, the bottom and top of each box represent the 25th and 75th percentiles, respectively, and the whiskers extend to 1.5 times the height of each box. The p value was calculated using the Mann–Whitney U test. (b) The ROC curve suggests that miR-155-5p expression could be used as a surrogate diagnostic biomarker in CLL.

