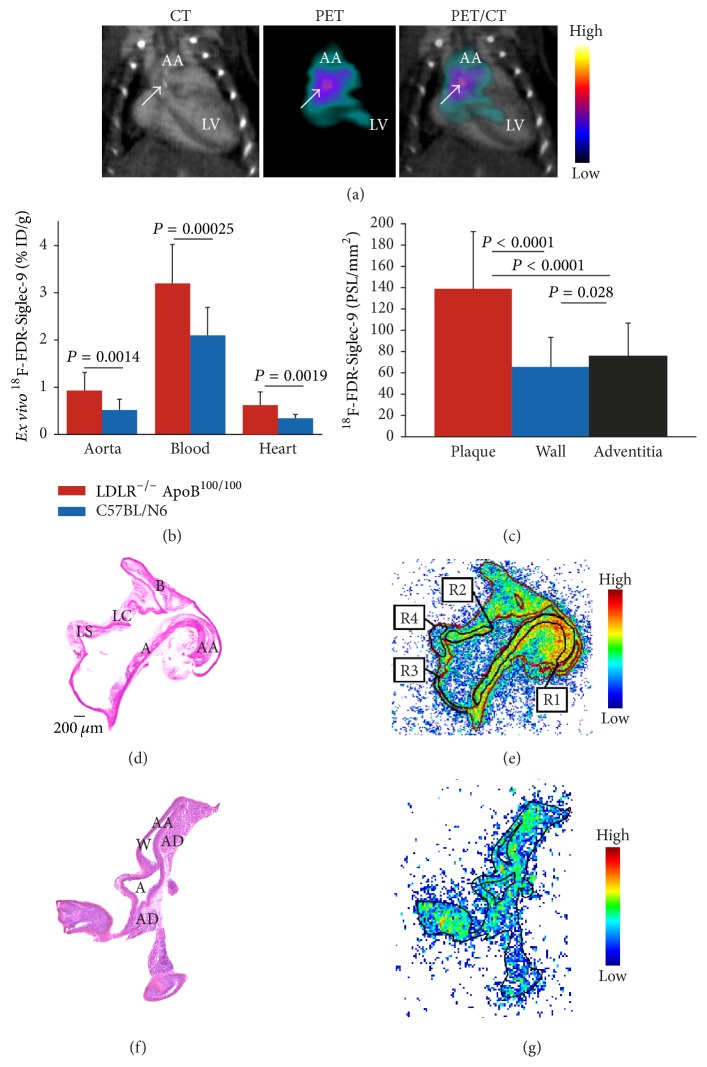
Figure 4.
(a) The 18F-FDR-Siglec-9 PET/CT detects atherosclerotic plaques in the aortic root with a target-to-background ratio (SUVmax,aortic arch/SUVmean,blood) of 1.6. The blood radioactivity concentration was determined from heart left ventricle using contrast-enhanced CT as anatomical reference. Arrow shows calcified atherosclerotic plaques in the aortic arch (a). (b) Ex vivo biodistribution of 18F-FDR-Siglec-9 in LDLR−/−ApoB100/100 (n = 19) and C57BL/N6 (n = 13) mice. (c) Quantification of 18F-FDR-Siglec-9 binding on the autoradiography of atherosclerotic mice aortas (n = 12, P values one-way ANOVA with Tukey's correction). (d) Representative hematoxylin-eosin staining of a longitudinally sectioned LDLR−/−ApoB100/100 mouse aorta and (e) a superimposed autoradiograph (red lines represent the borders of the hematoxylin-eosin image). R1 and R2 are regions of interest in the plaque (excluding the media), R3 is in normal vessel wall (no lesion formation), and R4 is in adventitia (mainly adipose tissue around the aorta). (f) Hematoxylin-eosin staining of a longitudinally sectioned healthy C57BL/6N control mouse aorta. (g) Superimposed autoradiograph and hematoxylin-eosin staining (the black line represents the borders of the hematoxylin-eosin image). A: arch; AA: ascending aorta; B: brachiocephalic artery; LC: left common carotid artery; and LS: left subclavian artery. PSL/mm2 = photostimulated luminescence/mm2 normalized for injected radioactivity dose.

