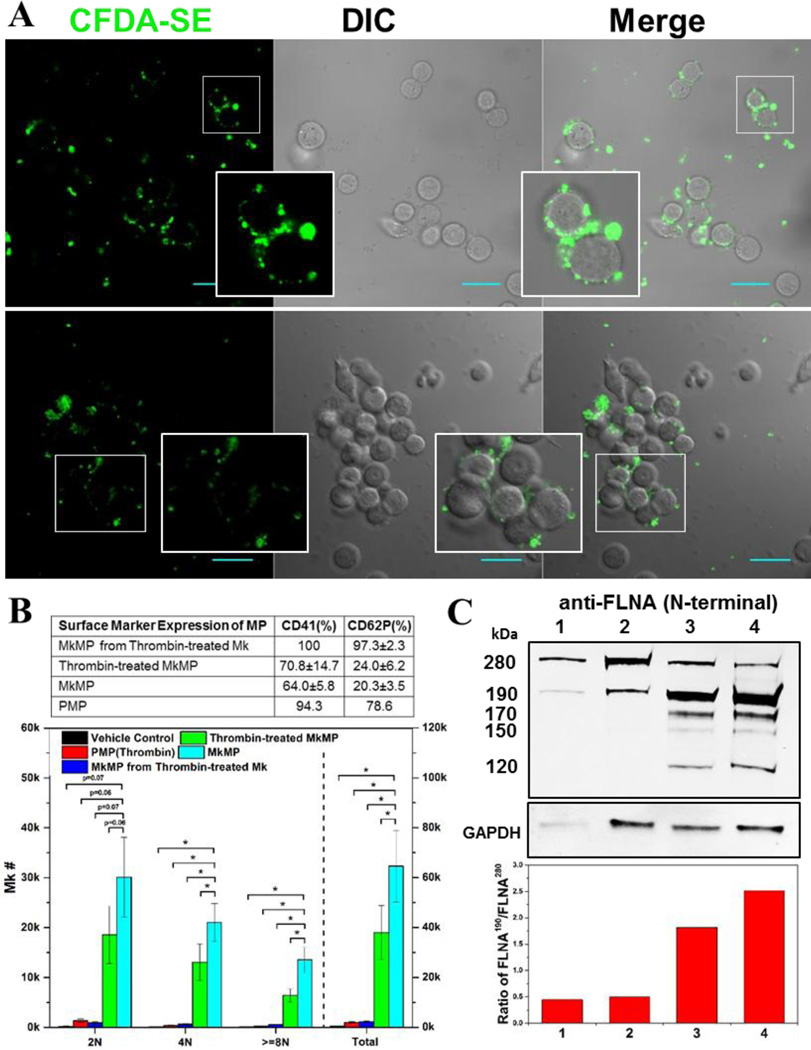
Fig. 7. PMPs are not taken up by HSPCs and a thrombin-mediated platelet-like activation may account for the different effects of MkMPs vs PMPs.
(A) PMPs were stained with CFDA-SE (green) dye and cocultured with d3 HSPCs for 3–5 hours. Fluorescent and DIC images were collected using confocal microscopy. PMPs were not taken up by HSPCs, but induced HSPC aggregation. There was no aggregation observed in the control cultures of HSPCs without PMPs (data not shown). Inserts amplify images to show more details. Scale bar, 20 µm. (B) Thrombin treatment activates Mk cells giving rise to MkMPs incapable of inducing Mk differentiation HSPCs, but direct MkMPs activation by thrombin is ineffective and attenuates but does not abolish the impact of MkMPs. Table displays CD41 and CD62P expression levels of various MP types to assess the impact of thrombin activation. The effect of thrombin treatment on the biological effects of MkMPs and PMPs was assessed by coculture with CD34+ cells (10 MPs/cell) for 7 days. Ploidy distribution of Mks at d7 was analyzed by flow cytometry. Error bars: standard error of mean (n=3); * P<0.05. (C) Assessment of thrombin activation via Western-blot examination of filamin A (FLNA) truncation as demonstrated by the relative amount of truncated filamin A (190 kDa; full size is 280 kDa) in MkMPs (lane 1), thrombin-treated MkMPs (lane 2), MkMPs from thrombin-treated Mks (lane 3), and PMPs (lane 4). GAPDH expression was used as loading control. The low panel displays the ratio of FLNA190 /FLNA280 estimated by quantitation of normalized band intensity of displayed Western blot and this ratio represents the level of filamin A cleavage. The majority of filamin A in MkMPs and thrombin-treated MkMPs was full-length, while most filamin A was cleaved in MkMPs from thrombin-treated Mks and PMPs. The 190 kDa N-terminal fragment of filamin A results from calpain-dependent cleavage, while the 170, 150, 120 kDa N-terminal fragments are products of caspase-3-dependent cleavage.

