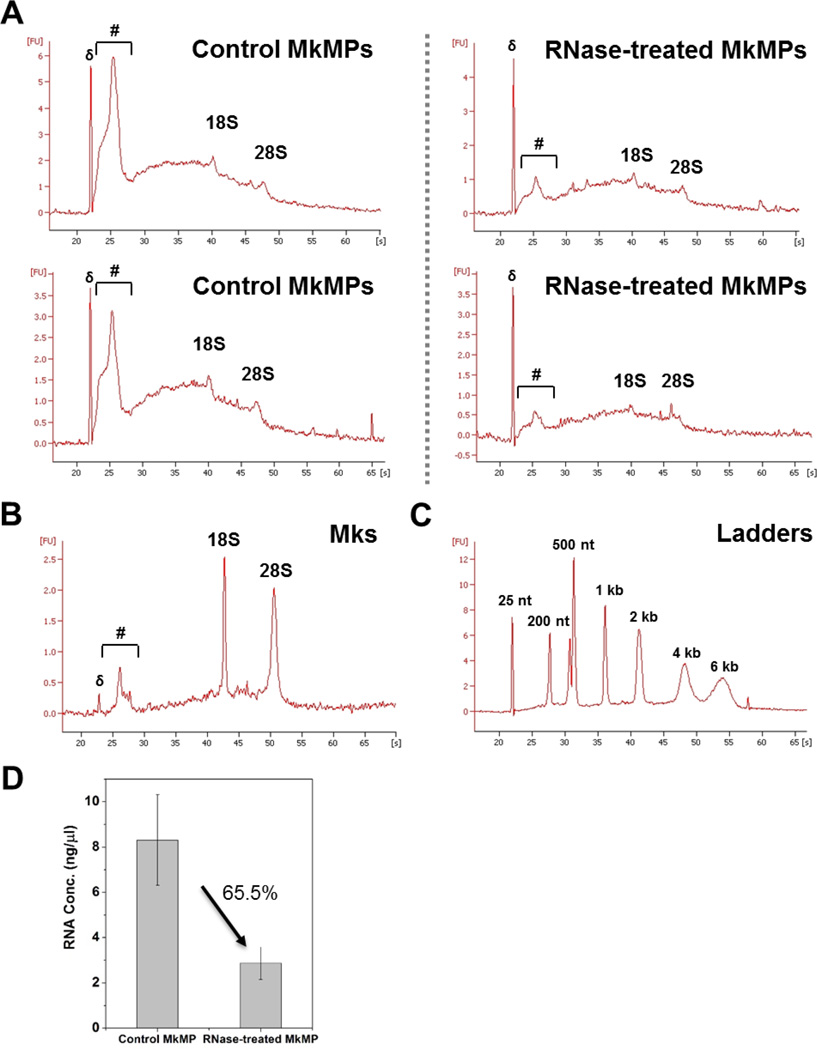
Fig. 9. RNA profile of Mk and MkMP with or without RNase treatment.
(A) MkMPs were first treated with or without RNase I for 2 hours at 37 °C. After incubated with RNase inhibitors and washed with IMDM thrice, total RNA were isolated from MkMPs and RNA profiles were analyzed by Bioanalyzer 2100. (B) RNA profile of d12 Mks. (A) presents the data from two biological replicates to demonstrate the exquisite reproducibility of the RNA profiles before and after RNase treatment. The symbol (#) in (A) and (B) marks the range of small RNAs. 18S and 28S represent rRNA, while (δ) in (A) and (B) marks the ladder of 25 nt. (C) RNA profile of ladders for size verification. (D) Total RNA concentration from MkMPs treated with or without were measured by Qubit RNA HS kit. The measurement shows 65.5% of RNA being digested after RNA treatment. The data represent two biological replicates ± standard deviation.

