10.
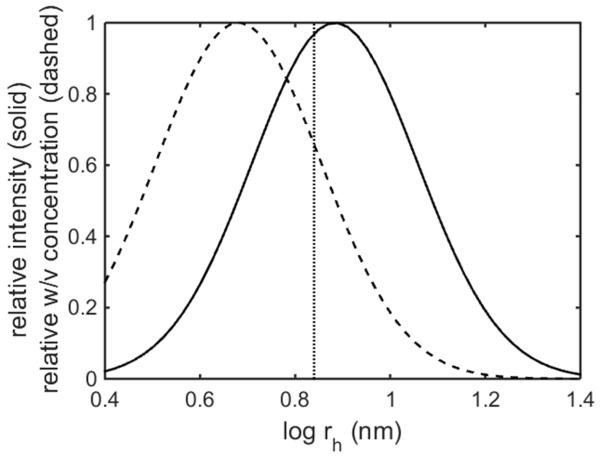
A. Relative distribution of scattering intensity plotted against log dh for HSA at 20°C, replotted from [50], solid curve. Relative distribution of w/v concentration calculated as described in text, dashed curve. Dotted line indicates approximate value of log dh expected for a homogeneous protein of M = 70,000.
B. Relative distribution of scattering intensity plotted against log dh for HSA at 70°C, replotted from [50], black curve. Relative distribution of w/v concentration calculated as described in text, red curve.


