Figure 1:

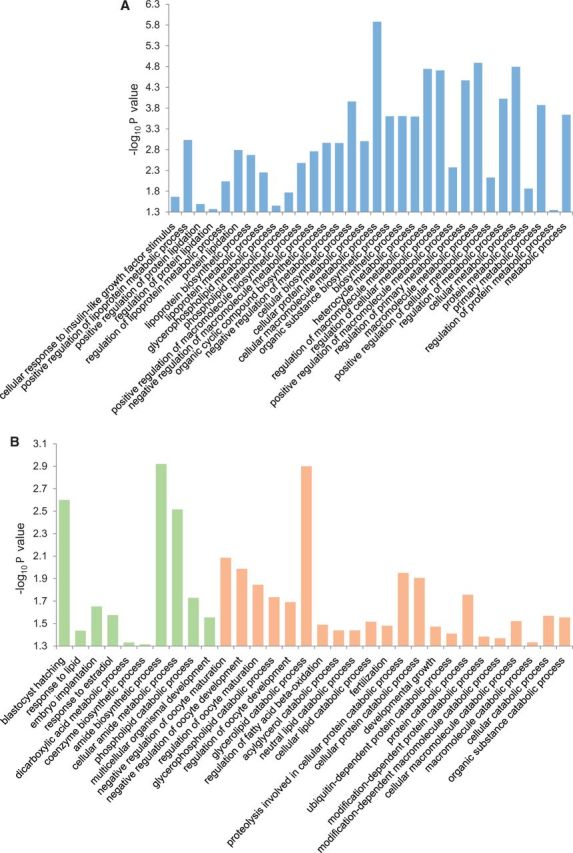
Enriched processes in (A) MERVL targets, and (B) tRF-Gly-GCC inhibition induced differentially expressed genes in embryos. Green and orange bars represent down- and up-regulated genes, in that order. Nominal significance P values (y axis, −log10) for enrichment are shown. Not all enriched processes are shown.
