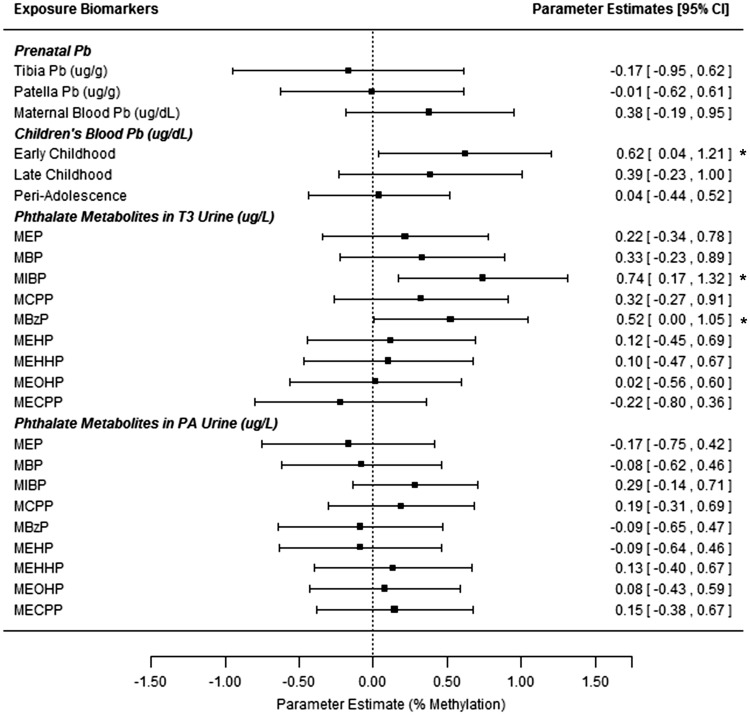
Figure 2:
associations between peri-adolescent H19 methylation and exposure biomarkers from multiple developmental stages. All estimates are from repeated measures models for H19 methylation at 4 CpG sites (from blood leukocyte DNA, PA study visit). Models adjust for children’s age and sex. All estimates give the change in % DNA methylation for an IQR range increase in the exposure biomarker (based on ln-transformed values for all biomarkers except tibia and patella Pb). *Denotes significant associations at the P ≤ 0.05 level. T3 = Trimester 3 (maternal samples).

