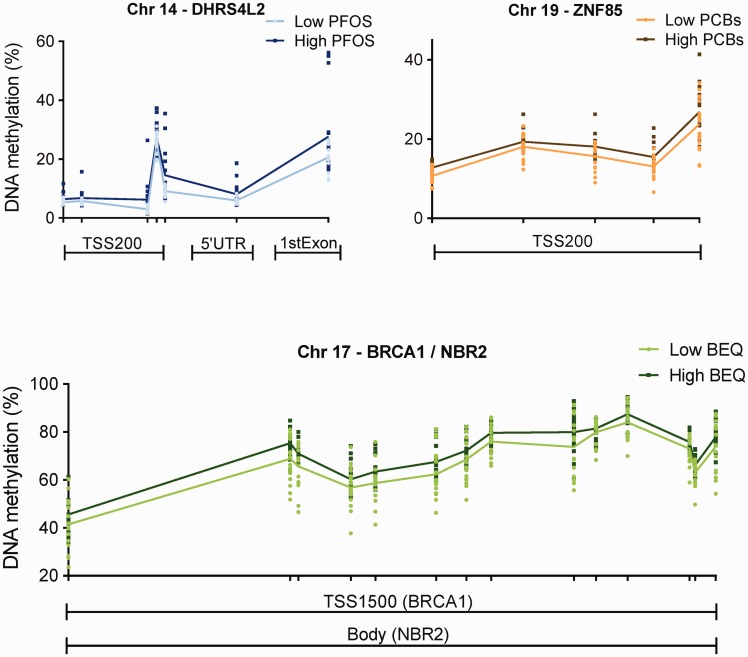
Figure 3.
representative differentially methylated regions detected in leukocytes in relation to PFOS (DHRS4L2), the sum of seven indicator PCBs (ZNF85) and to dioxins and dioxin-like compounds expressed in BEQ (BRCA1/NBR2), although similar DMRs were detected in relation to the other POPs (see online supplementary material for Tables S3–S5). Each dot represents methylation rate at the indicated position of individual samples and the lines show the average methylation levels. Analyses were based on continuous levels of the POPs; however, participants were categorized into two groups for visualization purposes. The light color represents the low-exposed group, while the dark color represents the high-exposed group based on the serum levels (median-split). Median (25–75 percentile) levels for the low- and the high-exposed group are 14.3 (6.9–33.6) and 96.9 (71.8–114) ng/g wet weight for PFOS, 246 (115–371) and 1635 (1095–2484) ng/g lipid for PCBs, and 17.1 (12.2–19.3), and 49.6 (35.2–70.7) for BEQ levels. 5’UTR, five prime untranslated region; Chr, chromosome; TSS200, 200 base pairs from the transcription start site; TSS1500, 1500 base pairs from the transcription start site

