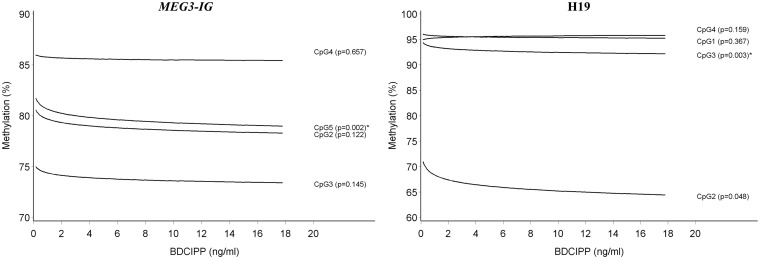
Figure 3:
DNA methylation in sperm by urinary BDCIPP concentration at the MEG3-IG and H19 DMRs; the predicted DNA methylation percentages at each CpG site are shown by BDCIPP concentration; adjusted for age and overweight/obesity status. *Associations that remained significant after taking into account multiple testing at all genes and CpG sites in this study

