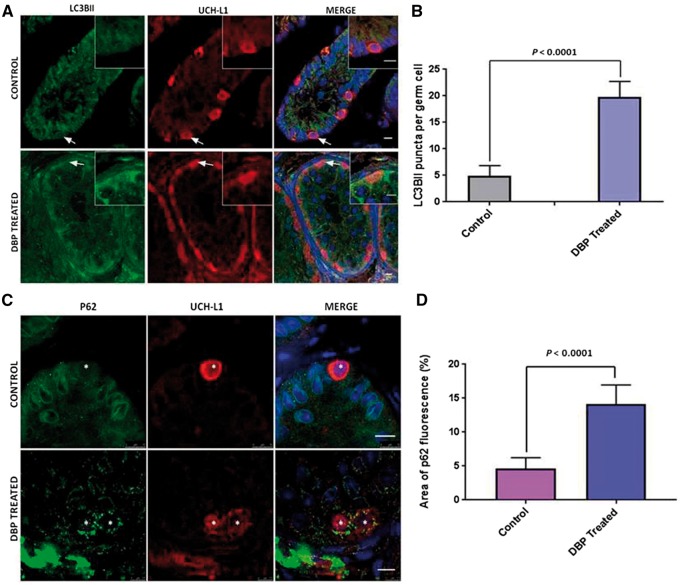
Figure 1:
induction of autophagy by DBP exposure in primate testis tissue. (A) Fluorescence microscopy analysis showing LC3BII expression in DBP treated tissue in comparison to the vehicle treated control. Arrows show cells in the inserts which are UCH-L1 positive cells showing LC3BII puncta. Nuclei are stained with DAPI (blue). Scale bars = 10 μm. (B) Number of LC3BII puncta per cell. Data shown is mean ± SEM from 20 different cells from 4 different samples from each group. Comparison made by unpaired t-test. (C) Immunofluorescence showing an accumulation of P62 protein in the cytoplasm of cells in DBP exposed tissue compared to the control. Asterisks mark UCH-L1 positive germ cells with P62 positive protein aggregates in the cytoplasm. Nuclei are stained with DAPI. Scale bars= 10 μm. (D) The area of fluorescence of the p62 cytoplasmic aggregates was quantified in the UCH-L1 positive germ cells. The data shown is mean ± SEM from 20 cells from 4 samples per treatment. Comparison made by unpaired t-test.

