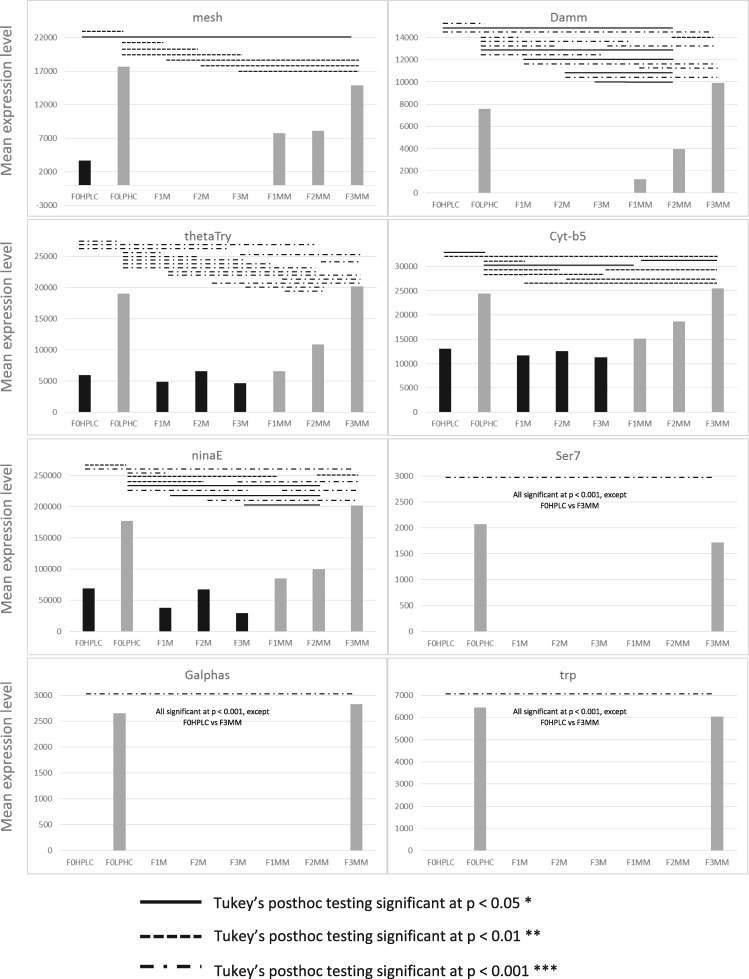
Figure 3:
Indicative graphs of gene expression of genes down-regulated in the F0 generation, with significances as determined by ANOVA, between F0 and F3 generations on matched and mismatched diets. Pairwise comparisons by Tukey’s post hoc testing indicated by solid and dashed lines, as described in the key. Y axis denotes mean expression level from transcriptomic experiments, and X axis denotes the dietary condition as per Figure. 1. Note differing Y axis scales. Gene names are stated as per their FlyBase gene symbol IDs.

