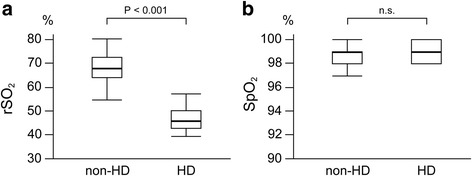
Fig. 1.

Box plots of preoperative rSO2 (a) and SpO2 (b) values stratified by HD. Horizontal bold lines represent median values. rSO 2 regional cerebral oxygen saturation, SpO 2 arterial oxygen saturation of pulse oximetry, HD hemodialysis, n.s. not significant
