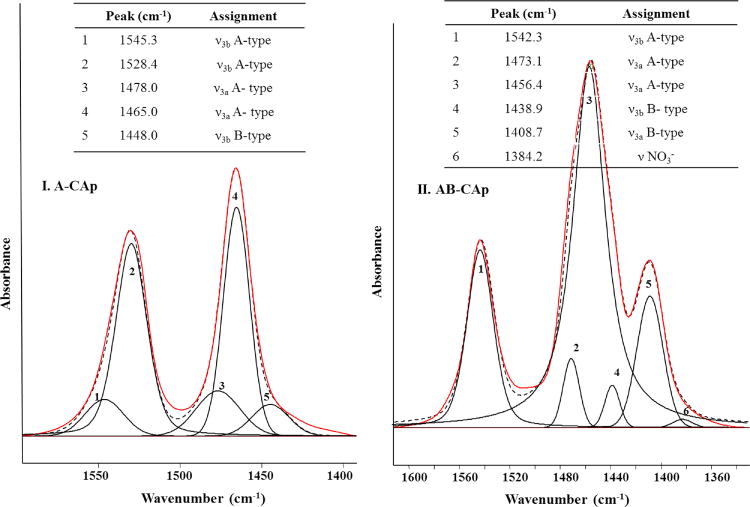
Figure 3.

Experimental (solid/red) FTIR spectrum and calculated (dashed/black) FTIR spectrum from the sum of the fitted curves (numbered). I. A-CAp in the 1400 – 1600 cm−1 carbonate ν3 region. II. AB-CAp2 in the 1320–1600 cm−1 region. The position and assignment of the fitted curves are reported (inset tables).
