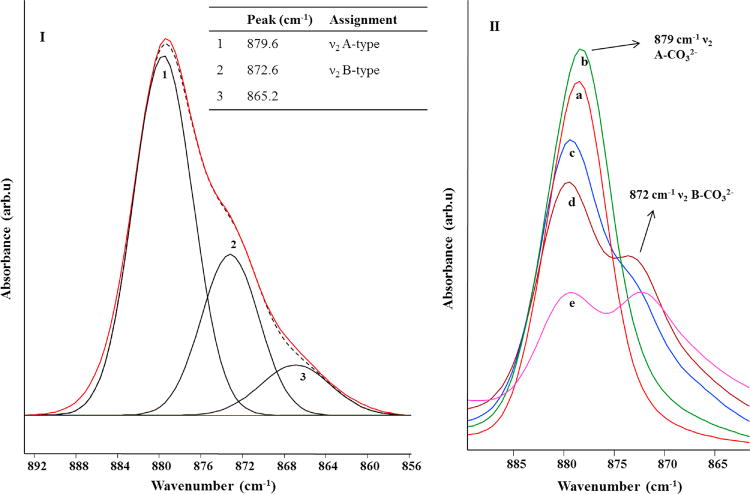
Figure 4.

I. Experimental (solid/red) and deconvolved (dashed/black) FTIR spectrum of AB-CAp2 in the 890–860 cm−1 carbonate ν2 region. The 3 fitted curves are also reported, together with position and assignment (inset table). II. FTIR spectra of the carbonate ν2 region showing the trend in the relative A-type and B-type carbonate in a) A-CAp, b) AB-CAp1, c) AB-CAp2, d) AB-CAp3, e) AB-CAp4.
