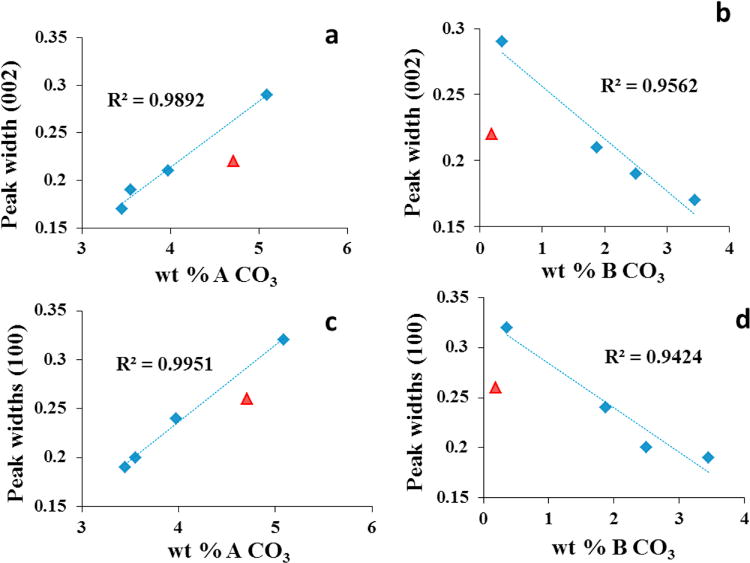
Figure 6.

Trends in the XRD peakwidths (FWHM) of the (002) lattice planes perpendicular to the c-axis relative to a) wt.% A-type carbonate and b) wt.% B-type carbonate in the AB-CAp samples. Trends in the XRD peakwidths of the (100) lattice planes perpendicular the a-axis relative to c) wt.% A-type carbonate and d) wt.% B-type carbonate in the AB-CAp samples. The triangle-shaped (▲) data point corresponds to the A-CAp sample while the diamond-shaped (◆) data points correspond to the AB-CAp samples. Trend lines with the R2 values were calculated for the series of AB-type apatites, but not including A-CAp.
