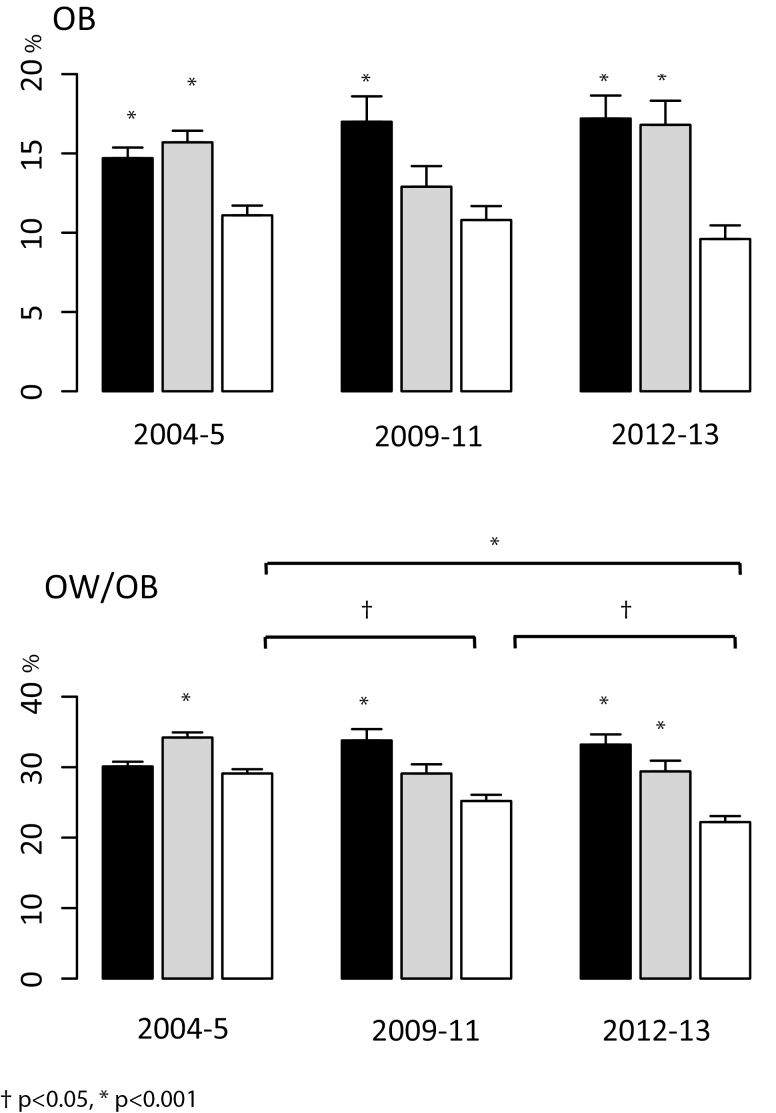
Figure 1.
Weighted prevalence (+SE) of OB (A) and OW/OB (B) by survey and income adequacy. To respect Statistics Canada privacy regulations for reporting prevalences, low- and low–middle-income categories were pooled for the lowest category (black bars); grey bars = upper middle income and white bars = high income. Asterisks above the vertical bars denote statistical significance compared to the reference category for each survey (high-income adequacy). The horizontal lines identify pairwise differences across survey eras in the highest income adequacy category. P values are marked as *P<0.001, †P<0.05.

