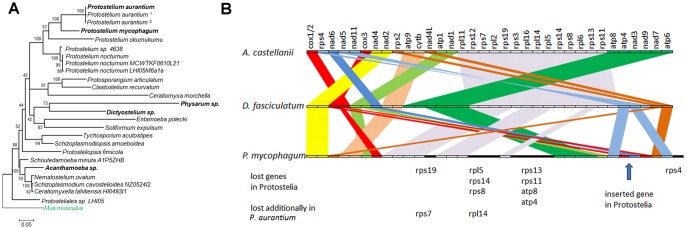
Fig. 2.
—Phylogeny and mitochondrial organization. (A) Phylogeny of selected protosteloid amoeba together with selected other amoebozoa based on 18 S RNA sequences. The species of which the genome sequences were analyzed are given in bold letters. Superscript numbers refer to recently renamed isolates of Protostelium aurantium with accession numbers 1FJ766461.1 and 2FJ766463.1. The alignment was cleaned of ambiguous positions using GBLOCKS (Talavera et al. 2007) reducing the observable distance between species and clades. A discrete Gamma distribution was used to model evolutionary rate differences among sites (5 categories [+G, parameter = 0.6214]). The tree is drawn to scale, with branch lengths measured in the number of substitutions per site. Evolutionary analyses were conducted in MEGA6 (Tamura et al. 2013). (B) Mitochondrial synteny between selected Amoebozoa. Genes are drawn as boxes of equal length. Syntenic regions are connected by colored bands.

