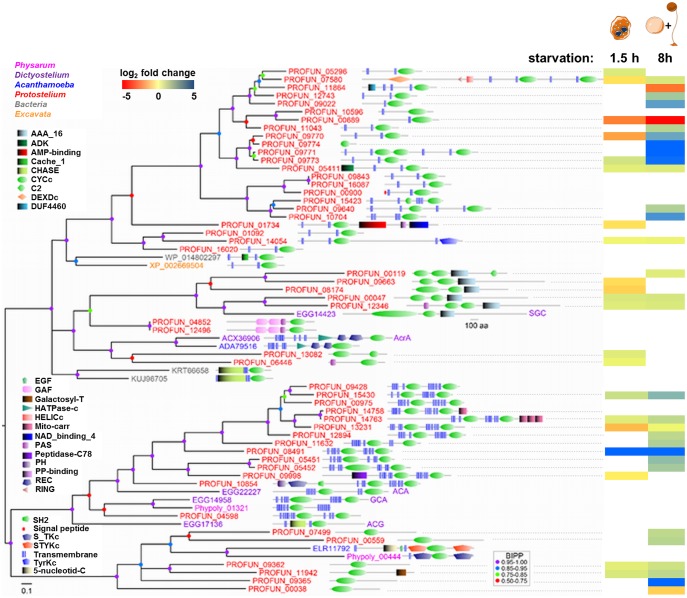
Fig. 6.
—Phylogeny of adenylate and guanylate cyclases. The phylogenetic tree was calculated with Bayesian inference (see Materials and Methods).The protein identifiers are color coded to reflect species names as indicated in the figure, and are annotated with the functional domain architecture of the proteins as determined by SMART (Schultz et al. 1998). PFAM domains are represented as colored to black graded rectangles. Posterior probabilities (BIPP) of tree nodes are indicated by colored dots. The heatmap indicates relative expression levels at 1.5 h (starvation) and 8 h (fruiting body formation) compared with the vegetative state. The cartoon illustrates the predominant cell types at these time points (see supplementary fig. S7, Supplementary Material online).

