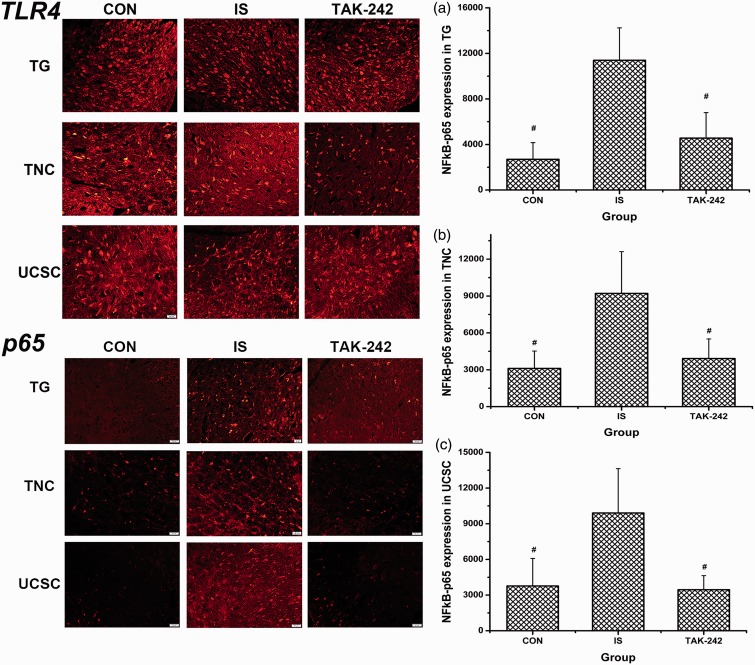
Figure 5.
Immunofluorescence of TLR4 and NF-κB p65 expression in the trigeminal pathway. The typical immunofluorescence samples were presented at the left part of the image, with the scale bar equalling to 50 μm. The right part showed the statistical results of NF-κB p65 expression in TG (a), TNC (b), and UCSC (c), respectively. All values given are the mean ± SD, n = 4. #P < 0.05 versus IS group. TG: trigeminal ganglion; TNC: trigeminal nucleus caudalis; UCSC: upper cervical spinal cord.

