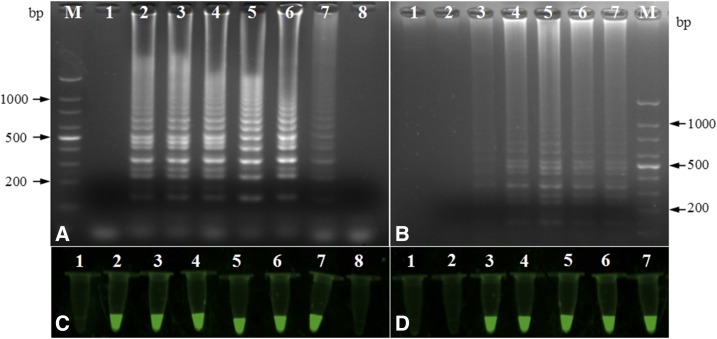
Figure 1.
Agarose gel electrophoretic and fluorescence analysis of the loop-mediated isothermal amplification products at different temperature and time. (A and C) 57°C (lane 2), 59°C (lane 3), 61°C (lane 4), 63°C (lane 5), 65°C (lane 6), 67°C (lane 7) and 69°C (lane 8); negative control (lane 1). (B and D): 15 minutes (lane 2), 30 minutes (lane 3), 45 minutes (lane 4), 60 minutes (lane 5), 75 minutes (lane 6) and 90 minutes (lane 7); negative control (lane 1). The DNA size markers are indicated on the sides. This figure appears in color at www.ajtmh.org.

