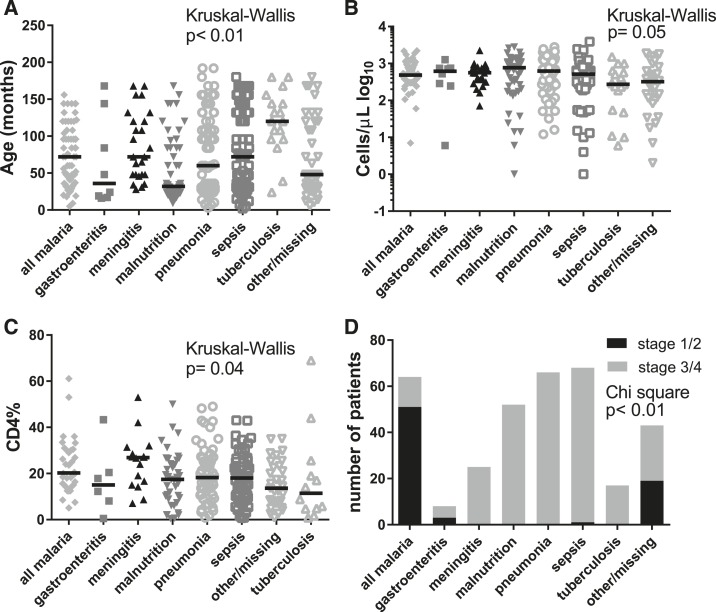
Figure 2.
Age distribution (A), CD4+ T cell absolute and CD4% (B, C) and HIV clinical stage (D) based on discharge diagnosis. Horizontal bars denote median values. (A) Age distribution based on discharge diagnosis. Age differed between groups (P < 0.01, Kruskal–Wallis test), driven by the older age of children with tuberculosis and younger age of children with malnutrition. Children with meningitis were older than children with malnutrition (multiplicity adjusted P < 0.04, Dunn’s Test), whereas children with tuberculosis were older than children with malnutrition (multiplicity adjusted P < 0.01, Dunn’s Test). (B) CD4+ T lymphocyte absolute count based on discharge diagnosis. CD4 count differed between groups (P = 0.05, Kruskal–Wallis test; although no significant difference was detected by post hoc Dunn’s test of multiple comparisons). Children with tuberculosis had lower median CD4 count (272 cells/µL) than children with malnutrition (766 cells/µL) or malaria (486 cells/µL, P = 0.04 and P = 0.02, respectively using Mann–Whitney U test). Note: scale of y axis is log10. (C) CD4+ T lymphocyte percent based on discharge diagnosis. CD4% did not differ between groups (P = 0.04, Kruskal–Wallis; although no significant difference was detected by post hoc Dunn’s test of multiple comparisons). Because of changes in Queen Elizabeth Central Hospital (QECH) testing procedure, not all children had CD4% performed. Children with tuberculosis had the lowest CD4% (11.4%). (D) HIV clinical stage and discharge diagnoses. HIV clinical stage differed based on discharge diagnosis (Chi-square, P < 0.01). Nearly all children with malnutrition, pneumonia, meningitis, tuberculosis, and sepsis had advanced clinical HIV disease severity (stage 3 or 4), whereas 79.7% of children with malaria had mild or asymptomatic clinical HIV disease (stage 1 or 2).

