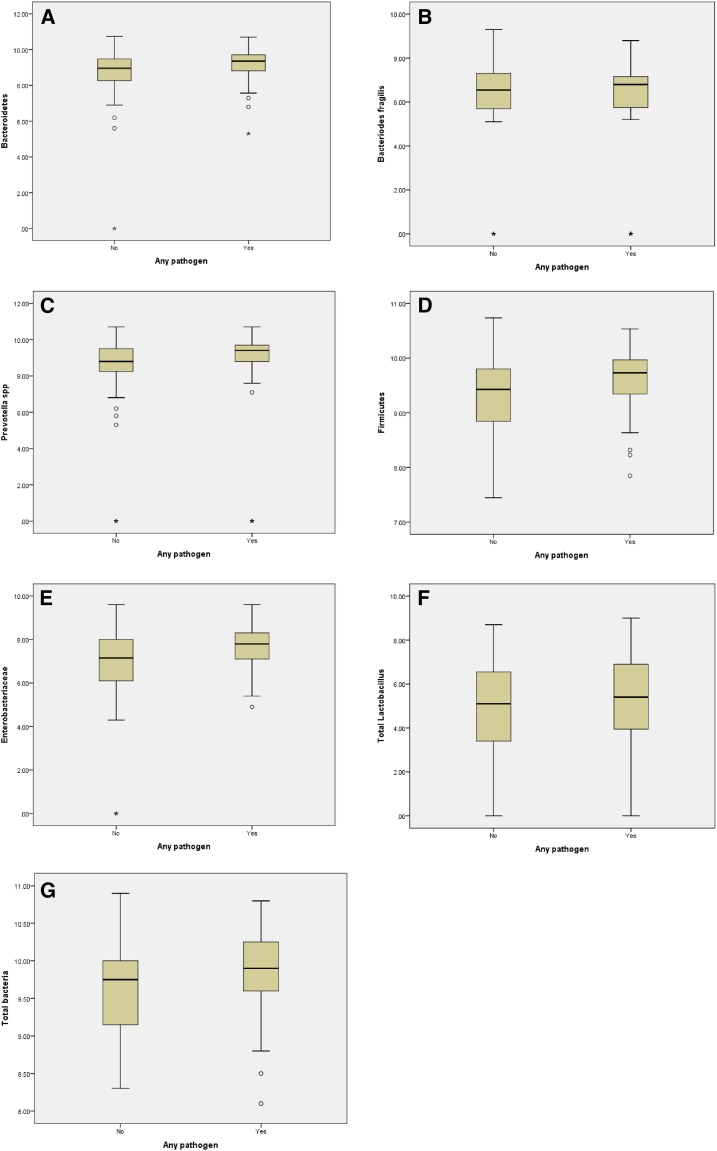
Figure 1.
Box plots comparing numbers of key bacterial communities in carriage positive and carriage negative individuals. (A) Bacteriodetes vs. any pathogen; (B) Bacteroides fragilis vs. any pathogen; (C) Prevotella spp. vs. any pathogen; (D) Firmicutes vs. any pathogen; (E) Enterobacteriaceae vs. any pathogen; (F) Total Lactobacillus vs. any pathogen; (G) Total bacteria vs. any pathogen. This figure appears in color at www.ajtmh.org.

