Supplemental Digital Content is available in the text.
Keywords: pathway analysis, pharmacogenomics, renin–angiotensin pathway, RNA sequencing
Abstract
Objectives
The majority of drug dosing studies are based on adult populations, with modification of the dosing for children based on size and weight. This rudimentary approach for drug dosing children is limited, as biologically a child can differ from an adult in far more aspects than just size and weight. Specifically, understanding the ontogeny of childhood liver development is critical in dosing drugs that are metabolized through the liver, as the rate of metabolism determines the duration and intensity of a drug’s pharmacologic action. Therefore, we set out to determine pharmacogenes that change over childhood development, followed by a secondary agnostic analysis, assessing changes transcriptome wide.
Materials and methods
A total of 47 human liver tissue samples, with between 10 and 13 samples in four age groups spanning childhood development, underwent pair-end sequencing. Kruskal–Wallis and Spearman’s rank correlation tests were used to determine the association of gene expression levels with age. Gene set analysis based on the pathways in KEGG utilized the gamma method. Correction for multiple testing was completed using q-values.
Results
We found evidence for increased expression of ‘very important pharmacogenes’, for example, coagulation factor V (F5) (P=6.7×10⁻⁷), angiotensin I converting enzyme (ACE) (P=6.4×10⁻³), and solute carrier family 22 member 1 (SLC22A1) (P=7.0×10⁻⁵) over childhood development. In contrast, we observed a significant decrease in expression of two alternative CYP3A7 transcripts (P=1.5×10⁻⁵ and 3.0×10⁻⁵) over development. The analysis of genome-wide changes detected transcripts in the following genes with significant changes in mRNA expression (P<1×10⁻⁹ with false discovery rate<5×0−5): ADCY1, PTPRD, CNDP1, DCAF12L1 and HIP1. Gene set analysis determined ontogeny-related transcriptomic changes in the renin–angiotensin pathway (P<0.002), with lower expression of the pathway, in general, observed in liver samples from younger participants.
Conclusion
Considering that the renin–angiotensin pathway plays a central role in blood pressure and plasma sodium concentration, and our observation that ACE and PTPRD expression increased over the spectrum of childhood development, this finding could potentially impact the dosing of an entire class of drugs known as ACE-inhibitors in pediatric patients.
Introduction
Personalized medicine’s goal of improving the efficacy of treatments for diseases has been a recent focus in clinical and translational research. Today, the feasibility of large-scale assays of biological markers, most importantly next-generation sequencing, enables researchers and clinicians to not only identify the genomic basis of disease etiology, but also predict how a patient will respond to different types of treatment. Individualized treatment decisions based on such information has the potential to improve efficacy and reduce life-threatening toxicities. However, a major challenge in implementing personalized medicine in pediatrics is identifying the appropriate drug dosages for children. The majority of drug dose-response studies are based on adult populations, with children dosing guidelines modified based on size/weight of the patient. This rudimentary approach for drug dosing in children is limited, as biologically a child can differ from an adult in far more aspects than just size and weight. That is, understanding the ontogeny of childhood liver development is critical in dosing drugs that are metabolized through the liver, as the rate of metabolism determines the duration and intensity of a drug’s pharmacologic action.
Initial pharmacogenomic studies in children on warfarin 1 and cholesterol-lowering statin medications 2 suggest that data derived from adults are not generally suitable to extrapolate to children. Equally concerning are that adverse events, rarely occurring or nonobservable in adults because of developmental changes in biological pathways, can be common in younger age groups 3–6. This is especially concerning considering that administering off-label drugs is widespread for children and that there is evidence suggesting potentially higher risk of adverse events for off-label prescriptions 7. Even if an adverse event is well understood to occur frequently in certain adult subpopulations, the ability and parameters necessary to predict its occurrence in children may differ. The fact that children younger than 2 years of age face severely increased risk of fatal valproate toxicity serves as a dramatic example 8. A recent investigation of valproate-induced changes in acid profiles does indeed imply that age-related changes in the ‘mitochondrial phenotype’ may be a key predisposing factor for the fatal response 9.
In order to help address these concerns, our study aimed to identify genes and pathways that undergo developmental changes in transcriptomic activity from infancy to adulthood and that are potentially involved in drug metabolism. The transcriptome of liver cells from children in four different age groups that span childhood development where evaluated using RNA sequencing. A specific emphasis in our analyses was put on the set of ‘very important pharmacogenes’ (VIPs) as defined by the PharmGKB database 10. This subset of genes is known to play an important role in individual drug metabolisms in adults, and, as such, any of its genes that undergo developmental changes in activity should be relevant when assessing the pediatric setting. As these genes are, again, mostly based on studies on adult populations, two additional genes, CYP3A7 and FMO1, were added to the set of VIPs, as expression of both is known to steadily decrease after birth and as both are involved in drug metabolism 11. In addition to looking at the candidate genes, we also looked genome wide to determine novel genes that show differences in expression across childhood development, as these genes might be potential biomarkers that could aid in the drug dosing of children.
Materials and methods
Liver samples
A total of 47 human liver tissue samples were obtained through the Brain and Tissue Bank for Developmental Disorders at the University of Maryland (Baltimore, Maryland, USA), the Liver Tissue Cell Distribution System (University of Pittsburgh and University of Minnesota), and XenoTech LLC (Lenexa, Kansas, USA). The use of these tissues was classified as nonhuman participant research by the Children’s Mercy Hospital Pediatric Institutional Review Board. Three main criteria were employed for selection of samples and individuals: absence of diseases or medications affecting the liver; an even spread across different age groups; and an RNA Quality Index greater than 8. Between 10 and 13 individuals were present in each of the four target age groups, which were defined as follows: less than 1 year of age (age group 1), 1 to less than 6 years (age group 2), 6 to less than 12 years (age group 3), and 12–18 years of age (age group 4). Characteristics of the study group are presented in Table 1.
Table 1.
Characteristics of four groups of pediatric patients

RNA-seq and bioinformatics processing
Extraction of RNA from the liver tissue samples was performed utilizing either the Qiagen (Germantown, Maryland, USA) AllPrep DNA/RNA Mini Kit or the Qiagen AllPrep DNA/RNA/miRNA Universal Kit. The RNA sequencing library of human liver transcriptomes was prepared using the Illumina TruSeq Stranded Total RNA Sample Prep Kit and the TruSeq Paired-End Cluster Kit. Paired-end sequencing was performed using the HiSeq. 1500 instrument, with each sample having an average mRNA depth of 104-fold (based on 2% mRNA), with more than 80% of bases above Q30. Mapping of RNA-seq reads to human reference genome (Genome Reference Consortium GRCh37, release date: February 2009) was completed using Bowtie 12, followed by abundance estimation of transcript level expression in transcripts per million (TPM) completed using RSEM 13. After processing of the raw reads, the effective library sizes for each sample (as measured by sum of the estimated abundances for all transcripts) ranged between 999 997 and 1 000 002; therefore, no additional normalization for differences in library size was completed.
Statistical analyses
To assess potential batch effects related to tissue source site, principal component analysis was completed, in which, for each participant, the first two principal components were plotted in a scatterplot, with different plotting symbols and colors used to represent the age groups and the tissue source sites. Two statistical tests were employed to discover potential candidates of genes that had different gene expression levels among the four age groups. A nonparametric ANOVA test [i.e. Kruskal–Wallis (KW) test] was used to determine whether there were any differences in gene expression levels among the four groups, where age group was treated as a four-level categorical variable (i.e. 3 d.f. test). Transcripts for which expression levels followed a linear trend with respect to age group were identified using Spearman correlation with age group treated as an ordinal variable (e.g. 1, 2, 3, 4 for the four age groups). Fifty-six genes classified as VIPs were extracted from the genes’ data set (obtained 5 May 2015) from the PharmGKB download web page, with the addition of CYP3A7 and FMO1. Analysis of both the 56 VIP candidate genes and all genes (genome wide) used the same statistical methods. To adjust for multiple testing, false discovery rate q-values were computed for the genome-wide results 14. To assess the robustness of the results because of potential confounding of the less than 1 year age group with tissue source, analyses were also completed using only the three older age groups.
Gene set (GS) analysis was completed using the gamma method (GM) for summarizing gene-level results up to the 291 pathways in KEGG 15. The GM statistic is based on summing P values transformed using an inverse gamma (ω, 1) transformation 16,17 Application of different P-value transformations is achieved by changing the ω parameter, which varies the emphasis given to particular P values and which can be reexpressed as a soft truncation threshold (STT). When ω is 1, GM is equivalent to the commonly used Fisher’s method with an STT=1/e. For our pathway analyses, we set the STT value to 0.15. Because of dependency between expression of different genes in a GS or pathway, empirical GS P values where determined using permutation testing.
Results
Confounding
Twelve of 13 patient samples in the youngest age group (<1 year of age) originated from the same tissue site. This was especially concerning given the fact that gene expression of UMB samples diverge from the samples from the other sites, as seen from the results of the principal component analysis of the 10 000 most variable genes (Fig. 1). Because of this confounding of tissue site with age group, observed differences in expression could be caused by a true age effect, a tissue site effect or a combination of both. Therefore, to determine robustness of results, all analyses were executed twice: utilizing all participants from all age groups (primary analysis) and excluding participants from the youngest age group (age group 1) (secondary analysis). We will refer to the former as ‘four group analysis’ and to the latter as ‘three group analysis’.
Fig. 1.
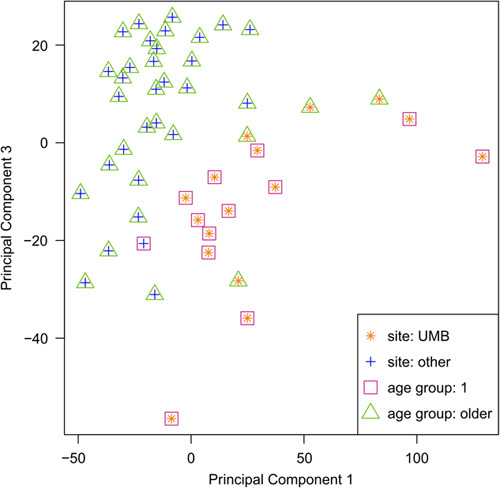
Principal component analysis of the 10 000 most variable transcripts across all participants. Age group one exhibits confounding with the UMB site of sample origin. UMB samples separate from other samples in PCA plot. PCA, principal component analysis.
VIP genes
The four group analysis of the 56 VIP genes (409 transcripts) led to a total of 28 significant VIP transcripts with a P-value of less than 0.01 (Table 2). However, in the sensitivity analysis (i.e. the three group analysis) only coagulation factor V gene, F5, had a transcript (ENST00000546081) with a P value of less than 0.01. This transcript was observed to have increased expression in the older age groups [mean TPM of 1.65, 3.15, 5.99 and 6.27 for age group 1 (youngest), 2, 3 and 4 (oldest), respectively]. Four additional transcripts in genes angiotensin I converting enzyme (ACE), SLC22A1 and CYP3A7 (two transcripts) were borderline significant (P<0.05). ACE and SLC22A1 transcripts exhibited higher expression levels in the older age groups, whereas CYP3A7 expression decreased with age. Figure 2a presents the TPM expression data for these five transcripts for the four age groups. Results for all VIP gene transcripts are presented in Supplementary Table 1 (Supplemental digital content 1, http://links.lww.com/FPC/B308).
Table 2.
Very important pharmacogenes with P value up to 0.01 for trend or categorical tests
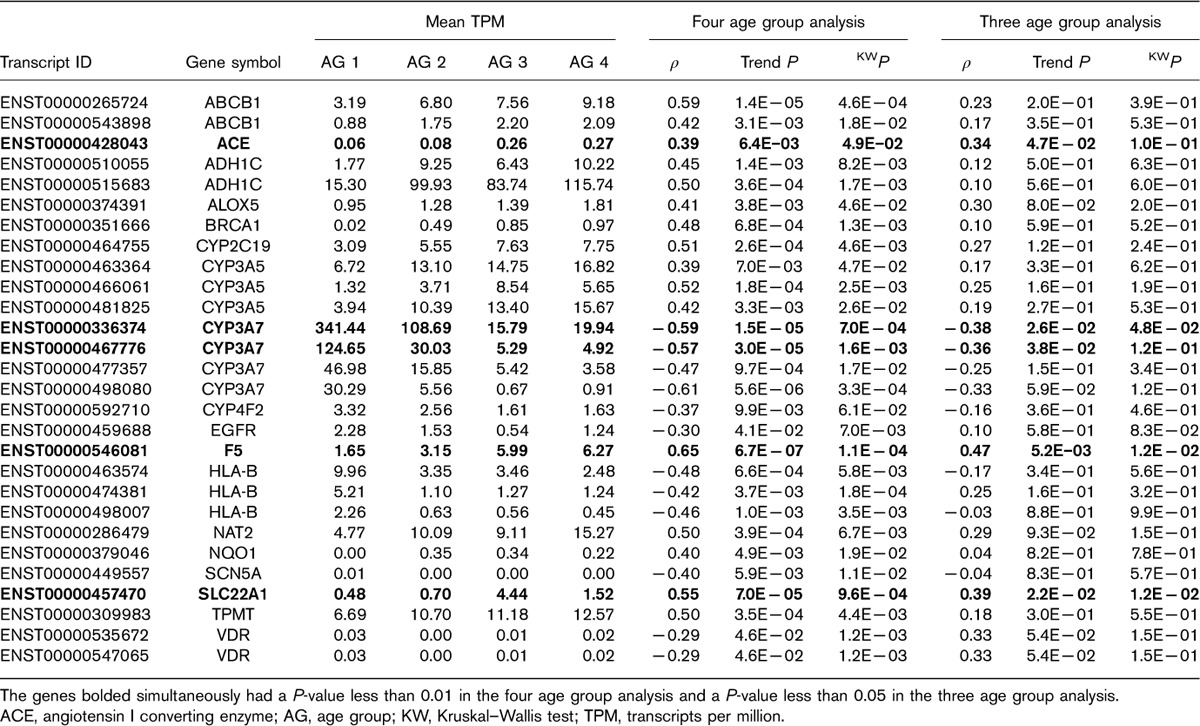
Fig. 2.
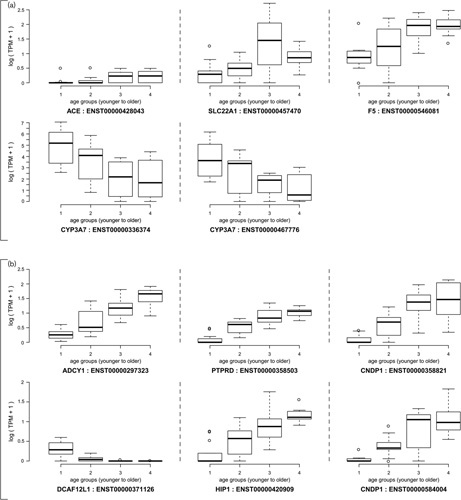
(a) Plot of TPM values for transcripts in VIP genes CYP3A7 (ENST00000336374 and ENST00000467776), F5 (ENST00000546081), ACE (ENST00000428043) and SLC22A1 (ENST00000457470) by age group. (b) Plot of TPM values for transcripts in genes ADCY1 (ENST00000297323), PTPRD (ENST00000358503), CNDP1 (ENST00000358821 and ENST00000584004), DCAF12L1 (ENST00000371126) and HIP1 (ENST00000420909). ACE, angiotensin I converting enzyme; TPM, transcripts per million.
Genome-wide results
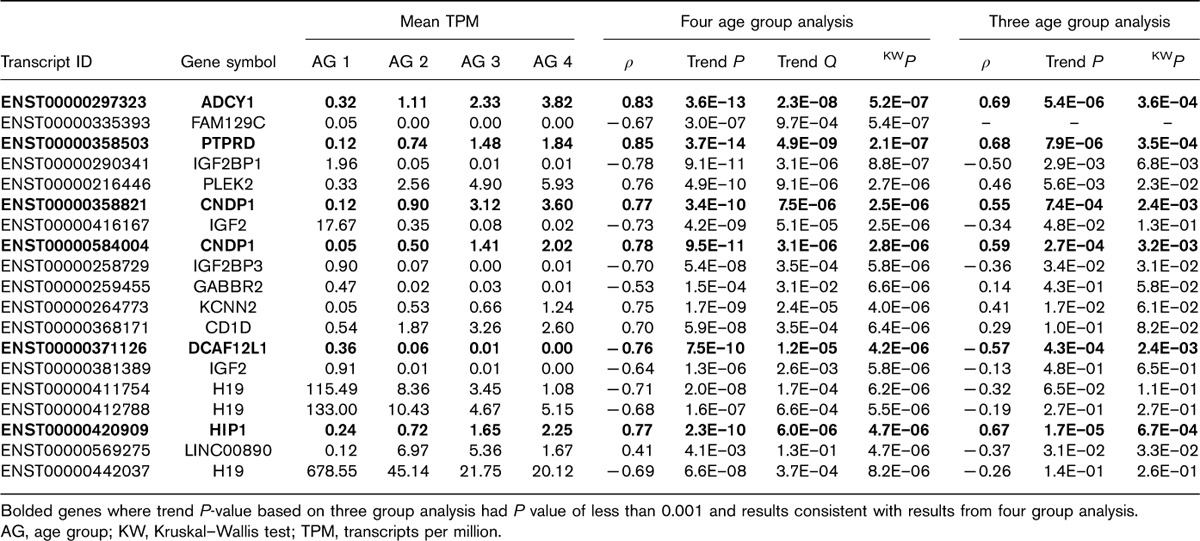
In the four age group analysis, a total of 19 transcripts exhibited a KW q value less than 0.05, whereas 1140 transcripts exhibited a trend (Spearman correlation) q value less than 0.05. However, no transcript exhibiteda KW q value less than 0.05 and only one transcript (ENST00000522096 of gene CTC-455F18.3) exhibited a trend q value less than 0.05 in the three age group analysis. With respect to the KW test, six of the 19 significant candidates from the four age group analysis exhibited P values less than 0.001 in the three age group analysis (Table 3). These six transcripts involved genes ADCY1, PTPRD, CNDP1, DCAF12L1 and HIP1, with all transcripts showing an increase in mean TPM expression levels in the older age groups, with the exception of DCAF12L1 (ENST00000371126). The data for these six transcripts are presented in Fig. 2b.
Table 3.
Results from four group analysis based on Kruskal–Wallis false discovery rate q value of less than 0.05
A heatmap of the transcripts with a P value less than 0.0001 (either trend test or KW test based on the four age group analysis) revealed that samples separated into two main clusters (Fig. 3a). The first cluster group contained all 13 participants from the youngest age group, along with four participants from age group 2 and one participant from each of the older age groups. Additionally, this cluster contains all but three participants from the tissue location UMB site. The second cluster, in contrast, contained no participants from the youngest age group and no participants from the UMB tissue site. To assess robustness of the genome-wide transcriptome analysis findings to possible confounding between tissue site and age, a heatmap constructed using only the genes with P value less than 0.05 in the three age group analysis is displayed in Fig. 3b (i.e. sensitivity analysis). As the figures illustrate, the separation between the age groups is less pronounced in Fig. 3b, as compared with Fig. 3a. However, the key thing to note is that the age effects do not seem to be confounded with tissue site and that age group 2 separates from age groups 3 and 4 in this set of genes.
Fig. 3.
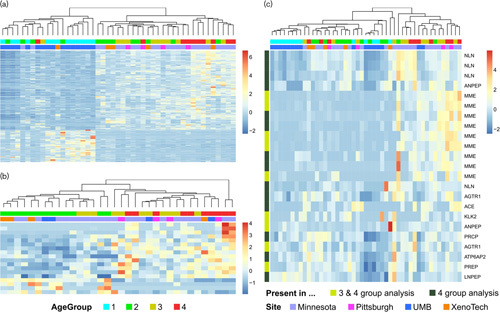
(a) Heatmap of transcripts from genome-wide analysis with a P value less than 0.0001 from four age group analysis; (b) Heatmap of transcripts from genome-wide analysis with a P value less than 0.0001 from three age group analysis (c) Heatmap of transcripts from the renin–angiotensin system pathway with a P value less than 0.05 from four age group analysis and/or three group analysis.
Pathway analysis results
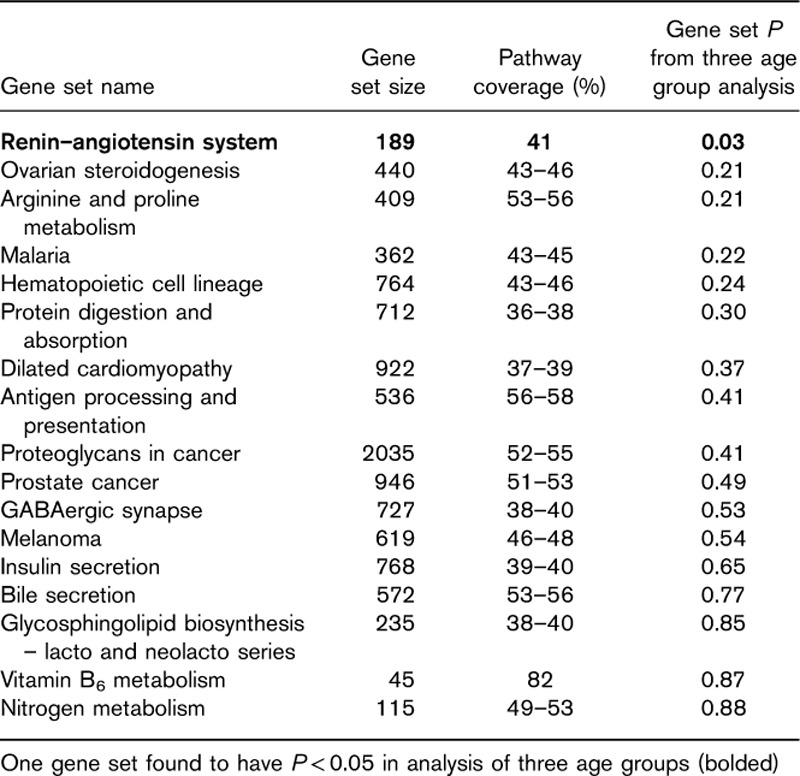
GS analysis based on the results from the four age group analysis found seventeen KEGG pathways with P value less than 0.002. Of these pathways, the renin–angiotensin system pathway also achieved a P value of less than 0.05 in the three age group analysis (Table 4). No other pathway achieved a P value smaller than 0.05 using the results from the three age group analyses. The renin–angiotensin system pathway contains 189 genes, of which 77 genes were included in the GS analysis. Further assessment of the renin–angiotensin system found that the set of transcripts in this pathway partially separated the participants into two groups. Heatmaps of transcripts from the renin–angiotensin system pathway with P value less than 0.05 exhibited partial separation of participants according to age (Fig. 3c), with higher TPM expression levels for genes in the GS observed in the oldest age groups (age group 3 and 4). The cluster of eight participants from age group one (first cluster on the left of the heatmap) cleanly separated from the other participants; however, this also consists of samples from a single tissue site. To assess robustness of the finding of the renin–angiotensin pathway, we have added a notation to the left side of the heatmap that denotes whether a gene transcript had a P value less than 0.05 in both the three and four age group analyses (yellow) or whether the transcript only had a P-value less than 0.05 in the four age group analysis (black). Of the 23 pathway transcripts with P value less than 0.05 from the four age group analysis, nine transcripts showed a similar relationship in the analysis of only three age groups (P<0.05). Genes with significant transcripts (P<0.05) in both analyses include MME, KLK2, ANPEP, angiotensin II receptor type 1 (AGTR1) and PREP (Fig. 3c).
Table 4.
Gene sets with empirical P value of less than 0.002 based on four age group analysis
Discussion
Little research has been completed to look at the age-related changes in the liver transcriptome over the developmental period newborn to adolescence. Therefore, we set out to determine pharmacogenes (i.e. VIPs) that change over childhood development, followed by a secondary agnostic analysis assessing changes transcriptome wide. With respect to the analysis of the VIPs, we found some evidence for transcripts in genes F5, ACE, SLC22A1 showing increased expression over the development period (Table 2 and Fig. 2a). F5, or coagulation factor V, is a critical gene involved in blood coagulation. This gene has been extensively studied, with over 400 validated genetic variants, of which 22 result in amino acid change, including the 1691G>A substitution (i.e. factor V Leiden), which prevents deactivation of coagulation factor V by activated protein C 18. Currently there are seven FDA drug warning labels related to F5 deficiency, including the drug eltrombopag used in the treatment of low platelet counts, as patients may experience thromboembolic events. ACE or ACE1 is an enzyme involved in the conversion of angiotensin I to angiotensin II, where angiotensin II is involved in blood pressure control. ACE is also a key component in the renin–angiotensin–aldosterone system. In addition, GS analysis determines ontogeny-related transcriptomic changes in the renin–angiotensin pathway (Table 4), with lower expression of the pathway, in general, observed in liver samples from younger participants (Fig. 3c). The renin–angiotensin pathway is a complex pathway consisting of over 150 genes, of which many genes beyond ACE were found to change in the liver over childhood development, including genes MME (P=1.9×10⁻⁷ four age group, P=0.0025 three age group) and AGTR1 (P=0.002 four age group, P=0.007 three age group), both of which showed increased expression over development (Fig. 3c). MME is a type II transmembrane glycoprotein that encodes for the protein CD10, for which a previous study found that protein CD10 expression was absent in livers from infants and children less than 24 months of age 19. AGTR1, associated with essential hypertension and renal dysplasia, has previously been reported to have higher expression in adult mice and rats compared with fetal and neonate animals 20,21. Considering that this pathway plays a central role in blood pressure and plasma sodium concentration 22 and our observation that ACE, MME and AGTR1 expression is increasing over the spectrum of childhood development, this finding could potentially impact the dosing of an entire class of drugs known as ACE-inhibitors in pediatric patients. Currently, there are no drug labeling notes related to variation in the expression of or mutation in these three genes.
Our findings for increased mRNA expression of SLC22A1 over childhood development were also reported in other studies. Burgess et al. 23 observed increase in SLC22A1 (solute carrier family 22 member 1) mRNA expression in liver samples from fetal and pediatric participants. However, they did not observe any difference in SLC22A1 expression between pediatric and adult livers. In addition, Hahn et al. 24 found a significant, steady increase in SLC22A1 protein expression during the development of children from neonates to 12 years of age, whereas Prasad et al. 25 observed age-related changes of hepatic drug transporters in livers between neonates and older age groups.
The last gene we observed with borderline significant age-related expression changes was CYP3A7. No only did two transcripts in this gene meet this criterion, but the overall group means of all CYP3A7 transcripts showed a decreasing trend with age (Supplementary Table 1, Supplemental digital content 1, http://links.lww.com/FPC/B308). Decreased expression of CYP3A7 between human fetal and postnatal liver, as well as, with increasing postnatal age is well recognized within the drug metabolism community. The fact that this trend was also observed in the limited number of samples investigated in this pilot study is consistent with previous investigations, and it suggests that genes showing association in both the three and four group analyses show promise to correspond to real associations that could potentially be relevant in pediatric pharmacodynamics 11. FMO1 neither met the criterion nor showed a consistent trend between transcripts, even though a similar profile than for the former gene would be expected. It is unclear whether this is a direct result of the confounding or attributable to a different cause.
The analysis of genome-wide changes detected the following transcripts (genes) with significant changes in mRNA expression (KW q<0.05 based on four age group analysis) that were also observed in the sensitivity analysis (Table 3): ENST00000297323 (ADCY1), ENST00000358503 (PTPRD), ENST00000358821 (CNDP1), ENST00000371126 (DCAF12L1), and ENST00000420909 (HIP1). All but the transcript in DCAF12L1 showed positive age-related changes in expression levels. Recently, a genome-wide association study found genetic variants in and near PTPRD to be associated with the efficacy of hypertension drugs trandolapril and verapamil 26. Because of the exploratory nature of the transcriptome-wide analyses, future work is needed to replicate these results in a larger set of pediatric liver samples.
The strengths of this study include the comprehensive assessment of mRNA changes using RNA sequencing technology and the use of tissue samples from four age groups spanning less than 1–18 years of age. However, a significant limitation of the study was the fact that samples from the youngest age group were primarily from one tissue source site, and therefore raise the possibility of confounding of differential expression results by tissue site. In addition, we chose to combine neonates and infants less than 1 year of age into one group because of sample size limitations. Thus, our ability to detect changes in transporter expression was limited compared with when analysis is restricted to the first few months of life 27. Although the CYP3A7 expression results discussed above are consistent with true age-related differences in expression, to assess the potential confounding effect of tissue source on the observed data, sensitivity analyses were completed, in which the association analyses were completed with the youngest age group removed from the analysis, with the goal of looking for consistency of association (e.g. similar association findings) observed across the two analyses. The fact that overall analyses based on the full data set lead to more significant candidates than the reduced analyses can be explained by the fact that larger sample size increases statistical power, but also by the fact that samples from the UMB site seem to differ the most from other samples and confound age group one.
Conclusion
Despite complications caused by confounding with site, this research provides preliminary evidence for age-related changes in transcriptional liver profiles for important pharmacogenes in human liver. Changes appeared to be more profound the younger a patient was, specifically noticeable in children younger than 6 years of age. Within the set of genes classified as VIPs, a handful of candidates of notable interest were identified (Table 2), of which the four genes (F5, ACE, SLC22A1, CYP3A7) showed the most promise as developmentally regulated genes. Pathway analysis suggested that transcription in the renin–angiotensin pathway could be significantly affected by age. Additional research is needed to validate these findings.
Supplementary Material
Supplemental Digital Content is available for this article. Direct URL citations appear in the printed text and are provided in the HTML and PDF versions of this article on the journal’s website, www.pharmacogeneticsandgenomics.com.
Acknowledgements
Funding for this research was provided by Children’s Mercy Hospital and University of Kansas Medical Center
Conflicts of interest
There are no conflicts of interest.
Footnotes
J. Steven Leeder and Brooke L. Fridley contributed equally to the writing of this article.
References
- 1.Biss TT, Avery PJ, Brandao LR, Chalmers EA, Williams MD, Grainger JD, et al. VKORC1 and CYP2C9 genotype and patient characteristics explain a large proportion of the variability in warfarin dose requirement among children. Blood 2012; 119:868–873. [DOI] [PubMed] [Google Scholar]
- 2.Wagner J, Abdel-Rahman SM. Pediatric statin administration: navigating a frontier with limited data. J Pediatr Pharmacol Ther 2016; 21:380–403. [DOI] [PMC free article] [PubMed] [Google Scholar]
- 3.Woods D, Thomas E, Holl J, Altman S, Brennan T. Adverse events and preventable adverse events in children. Pediatrics 2005; 115:155–160. [DOI] [PubMed] [Google Scholar]
- 4.Lee WJ, Lee TA, Pickard AS, Caskey RN, Schumock GT. Drugs associated with adverse events in children and adolescents. Pharmacotherapy 2014; 34:918–926. [DOI] [PubMed] [Google Scholar]
- 5.Jakobsen KD, Wallach-Kildemoes H, Bruhn CH, Hashemi N, Pagsberg AK, Fink-Jensen A, et al. Adverse events in children and adolescents treated with quetiapine: an analysis of adverse drug reaction reports from the Danish Medicines Agency database. Int Clin Psychopharmacol 2017; 32:103–106. [DOI] [PubMed] [Google Scholar]
- 6.Kimura G, Kadoyama K, Brown JB, Nakamura T, Miki I, Nisiguchi K, et al. Antipsychotics-associated serious adverse events in children: an analysis of the FAERS database. Int J Med Sci 2015; 12:135–140. [DOI] [PMC free article] [PubMed] [Google Scholar]
- 7.Turner S, Nunn AJ, Fielding K, Choonara I. Adverse drug reactions to unlicensed and off-label drugs on paediatric wards: a prospective study. Acta Paediatr 1999; 88:965–968. [DOI] [PubMed] [Google Scholar]
- 8.Bryant AE, 3rd, Dreifuss FE. Valproic acid hepatic fatalities. III. U.S. experience since 1986. Neurology 1996; 46:465–469. [DOI] [PubMed] [Google Scholar]
- 9.Price KE, Pearce RE, Garg UC, Heese BA, Smith LD, Sullivan JE, et al. Effects of valproic acid on organic acid metabolism in children: a metabolic profiling study. Clin Pharmacol Ther 2011; 89:867–874. [DOI] [PMC free article] [PubMed] [Google Scholar]
- 10.Whirl-Carrillo M, McDonagh EM, Hebert JM, Gong L, Sangkuhl K, Thorn CF, et al. Pharmacogenomics knowledge for personalized medicine. Clin Pharmacol Ther 2012; 92:414–417. [DOI] [PMC free article] [PubMed] [Google Scholar]
- 11.Lu H, Rosenbaum S. Developmental pharmacokinetics in pediatric populations. J Pediatr Pharmacol Ther 2014; 19:262–276. [DOI] [PMC free article] [PubMed] [Google Scholar]
- 12.Langmead B, Salzberg SL. Fast gapped-read alignment with Bowtie 2. Nat Methods 2012; 9:357–359. [DOI] [PMC free article] [PubMed] [Google Scholar]
- 13.Li B, Dewey CN. RSEM: accurate transcript quantification from RNA-Seq data with or without a reference genome. BMC Bioinformatics 2011; 12:323. [DOI] [PMC free article] [PubMed] [Google Scholar]
- 14.Storey JD, Tibshirani R. Statistical significance for genomewide studies. Proc Natl Acad Sci USA 2003; 100:9440–9445. [DOI] [PMC free article] [PubMed] [Google Scholar]
- 15.Kanehisa M, Furumichi M, Tanabe M, Sato Y, Morishima K. KEGG: new perspectives on genomes, pathways, diseases and drugs. Nucleic Acids Res 2017; 45 (D1):D353–D361. [DOI] [PMC free article] [PubMed] [Google Scholar]
- 16.Zaykin DV, Zhivotovsky LA, Czika W, Shao S, Wolfinger RD. Combining p values in large-scale genomics experiments. Pharm Stat 2007; 6:217–226. [DOI] [PMC free article] [PubMed] [Google Scholar]
- 17.Fridley BL, Jenkins GD, Grill DE, Kennedy RB, Poland GA, Oberg AL. Soft truncation thresholding for gene set analysis of RNA-seq data: application to a vaccine study. Sci Rep 2013; 3:2898. [DOI] [PMC free article] [PubMed] [Google Scholar]
- 18.Bertina RM, Koeleman BP, Koster T, Rosendaal FR, Dirven RJ, de Ronde H, et al. Mutation in blood coagulation factor V associated with resistance to activated protein C. Nature 1994; 369:64–67. [DOI] [PubMed] [Google Scholar]
- 19.Byrne JA, Meara NJ, Rayner AC, Thompson RJ, Knisely AS. Lack of hepatocellular CD10 along bile canaliculi is physiologic in early childhood and persistent in Alagille syndrome. Lab Invest 2007; 87:1138–1148. [DOI] [PubMed] [Google Scholar]
- 20.Tufro-McReddie A, Harrison JK, Everett AD, Gomez RA. Ontogeny of type 1 angiotensin II receptor gene expression in the rat. J Clin Invest 1993; 91:530–537. [DOI] [PMC free article] [PubMed] [Google Scholar]
- 21.Gao J, Chao J, Parbhu KJ, Yu L, Xiao L, Gao F, et al. Ontogeny of angiotensin type 2 and type 1 receptor expression in mice. J Renin Angiotensin Aldosterone Syst 2012; 13:341–352. [DOI] [PMC free article] [PubMed] [Google Scholar]
- 22.Hall JE. Control of blood pressure by the renin-angiotensin-aldosterone system. Clin Cardiol 1991; 14 (Suppl 4):IV6–IV21. [discussion IV51–IV25]. [DOI] [PubMed] [Google Scholar]
- 23.Burgess KS, Philips S, Benson EA, Desta Z, Gaedigk A, Gaedigk R, et al. Age-related changes in microRNA expression and pharmacogenes in human liver. Clin Pharmacol Ther 2015; 98:205–215. [DOI] [PMC free article] [PubMed] [Google Scholar]
- 24.Hahn D, Emoto C, Vinks AA, Fukuda T. Developmental changes in hepatic organic cation transporter OCT1 protein expression from neonates to children. Drug Metab Dispos 2017; 45:23–26. [DOI] [PMC free article] [PubMed] [Google Scholar]
- 25.Prasad B, Gaedigk A, Vrana M, Gaedigk R, Leeder JS, Salphati L, et al. Ontogeny of hepatic drug transporters as quantified by LC-MS/MS proteomics. Clin Pharmacol Ther 2016; 100:362–370. [DOI] [PMC free article] [PubMed] [Google Scholar]
- 26.Gong Y, McDonough CW, Beitelshees AL, El Rouby N, Hiltunen TP, O’Connell JR, et al. PTPRD gene associated with blood pressure response to atenolol and resistant hypertension. J Hypertens 2015; 33:2278–2285. [DOI] [PMC free article] [PubMed] [Google Scholar]
- 27.Leeder JS, Meibohm B. Challenges and opportunities for increasing the knowledge base related to drug biotransformation and pharmacokinetics during growth and development. Drug Metab Dispos 2016; 44:916–923. [DOI] [PubMed] [Google Scholar]
Associated Data
This section collects any data citations, data availability statements, or supplementary materials included in this article.
Supplementary Materials
Supplemental Digital Content is available for this article. Direct URL citations appear in the printed text and are provided in the HTML and PDF versions of this article on the journal’s website, www.pharmacogeneticsandgenomics.com.


