
Fig. 1.
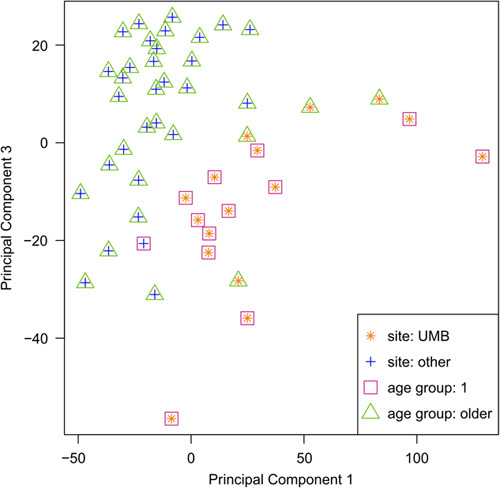
Principal component analysis of the 10 000 most variable transcripts across all participants. Age group one exhibits confounding with the UMB site of sample origin. UMB samples separate from other samples in PCA plot. PCA, principal component analysis.