
Fig. 2.
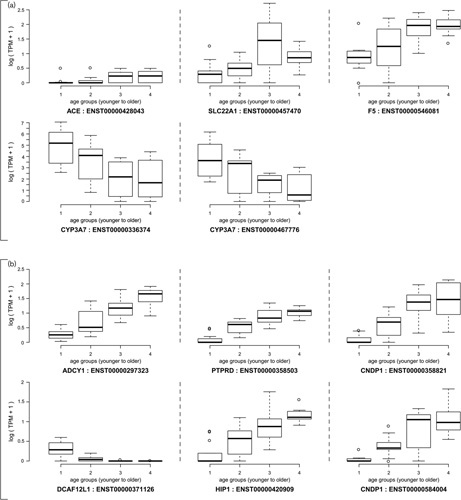
(a) Plot of TPM values for transcripts in VIP genes CYP3A7 (ENST00000336374 and ENST00000467776), F5 (ENST00000546081), ACE (ENST00000428043) and SLC22A1 (ENST00000457470) by age group. (b) Plot of TPM values for transcripts in genes ADCY1 (ENST00000297323), PTPRD (ENST00000358503), CNDP1 (ENST00000358821 and ENST00000584004), DCAF12L1 (ENST00000371126) and HIP1 (ENST00000420909). ACE, angiotensin I converting enzyme; TPM, transcripts per million.